You are viewing the RapidMiner Hub documentation for version 10.0 - Check here for latest version
Error Logs
RapidMiner Server maintains three types of logs that track activity. You can refer to these logs if the platform, a process or a job agent encounters an error:
- RapidMiner Server logs record activity related to platform operations. This includes startup processes, changes to settings, database accesses, etc. Any operations error is written to the RapidMiner Server log file.
- Process execution logs record the status of process execution.
- Job Agent logs record the status of Job Agents.
Viewing RapidMiner Server logs
RapidMiner Server stores its operational log files in the /log sub-folder of your RapidMiner Server home directory.
You can open the files with a text editor or view them using the web interface.
Viewing log files with a text editor
Using any text editor, open the file for the day you are interested in. The file for the current day is
called aihub.log. File names for previous days are in the format aihub.log. <date>.
Each line of the file is preceded with a time stamp to help locate the relevant information.
In addition, the log/ folder also contains any migration logs.
Viewing log files in the web interface
To view log files from the web interface:
Click on Management > Logs to open the Log view
The file for the current day, aihub.log, is preselected. To see previous logs, select the date you are interested in from the pull-down menu:

Viewing process execution logs
A process execution log file is available for each process execution on RapidMiner Server. You can view all process execution logs in the web interface of RapidMiner Server. The logs include both successful and failed processes.
The logs which are described below represent the logs which RapidMiner Studio produces during execution of a process, but those are exposed from the underlying execution unit (Job Agent) to AI Hub's web interface.
If you like more detailed logs during execution, you can
- change the Process parameter
log_verbositytoALLinside RapidMiner Studio for each process and write it back to AI Hub or - starting from AI Hub 9.10.10 override default log verbosity during execution inside Job Agents / Job Containers by setting the following environment variables for the Job Agent
JOBAGENT_CONTAINER_PROCESS_LOGGING_OVERRIDE_ENABLED=trueto enable override (defaults tofalse)JOBAGENT_CONTAINER_PROCESS_LOGGING_OVERRIDE_LEVEL=ALLto set the level (defaults toALL)
Viewing process execution logs from the web interface
You can view process execution logs from the web interface of RapidMiner Server. To do so, open Executions. All processes that are either scheduled for execution or already executed on the RapidMiner Server instance are listed:

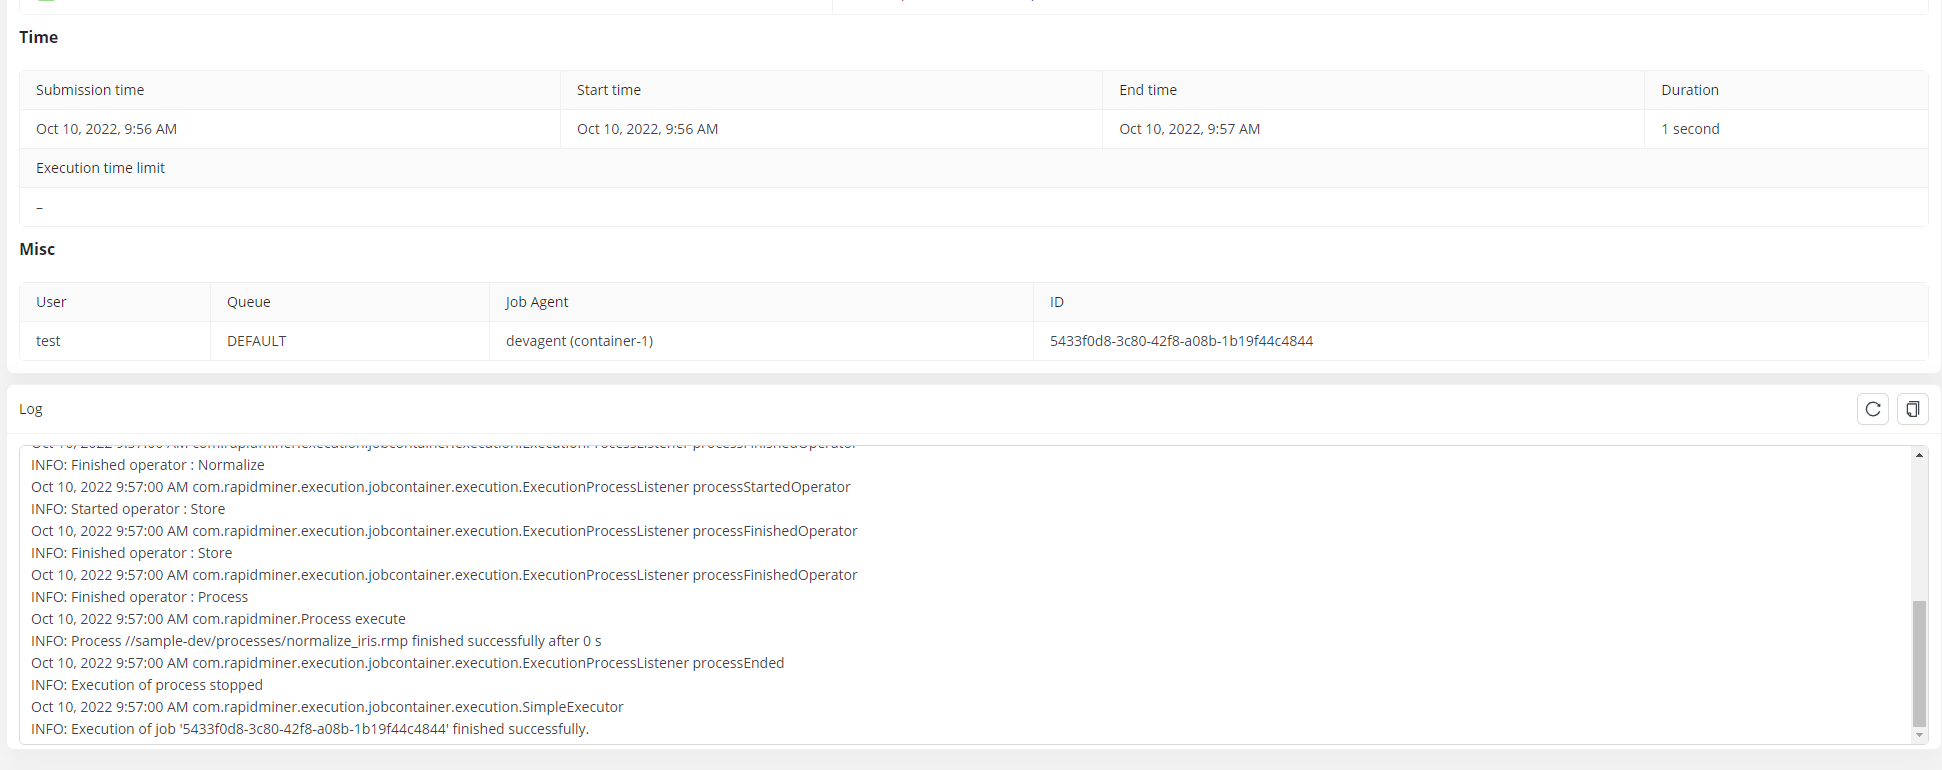
The listing provides an Actions column which has a View execution button which will show the details of your process execution. On the top you can see general information about the process execution, on the bottom you can find the logs of the process.

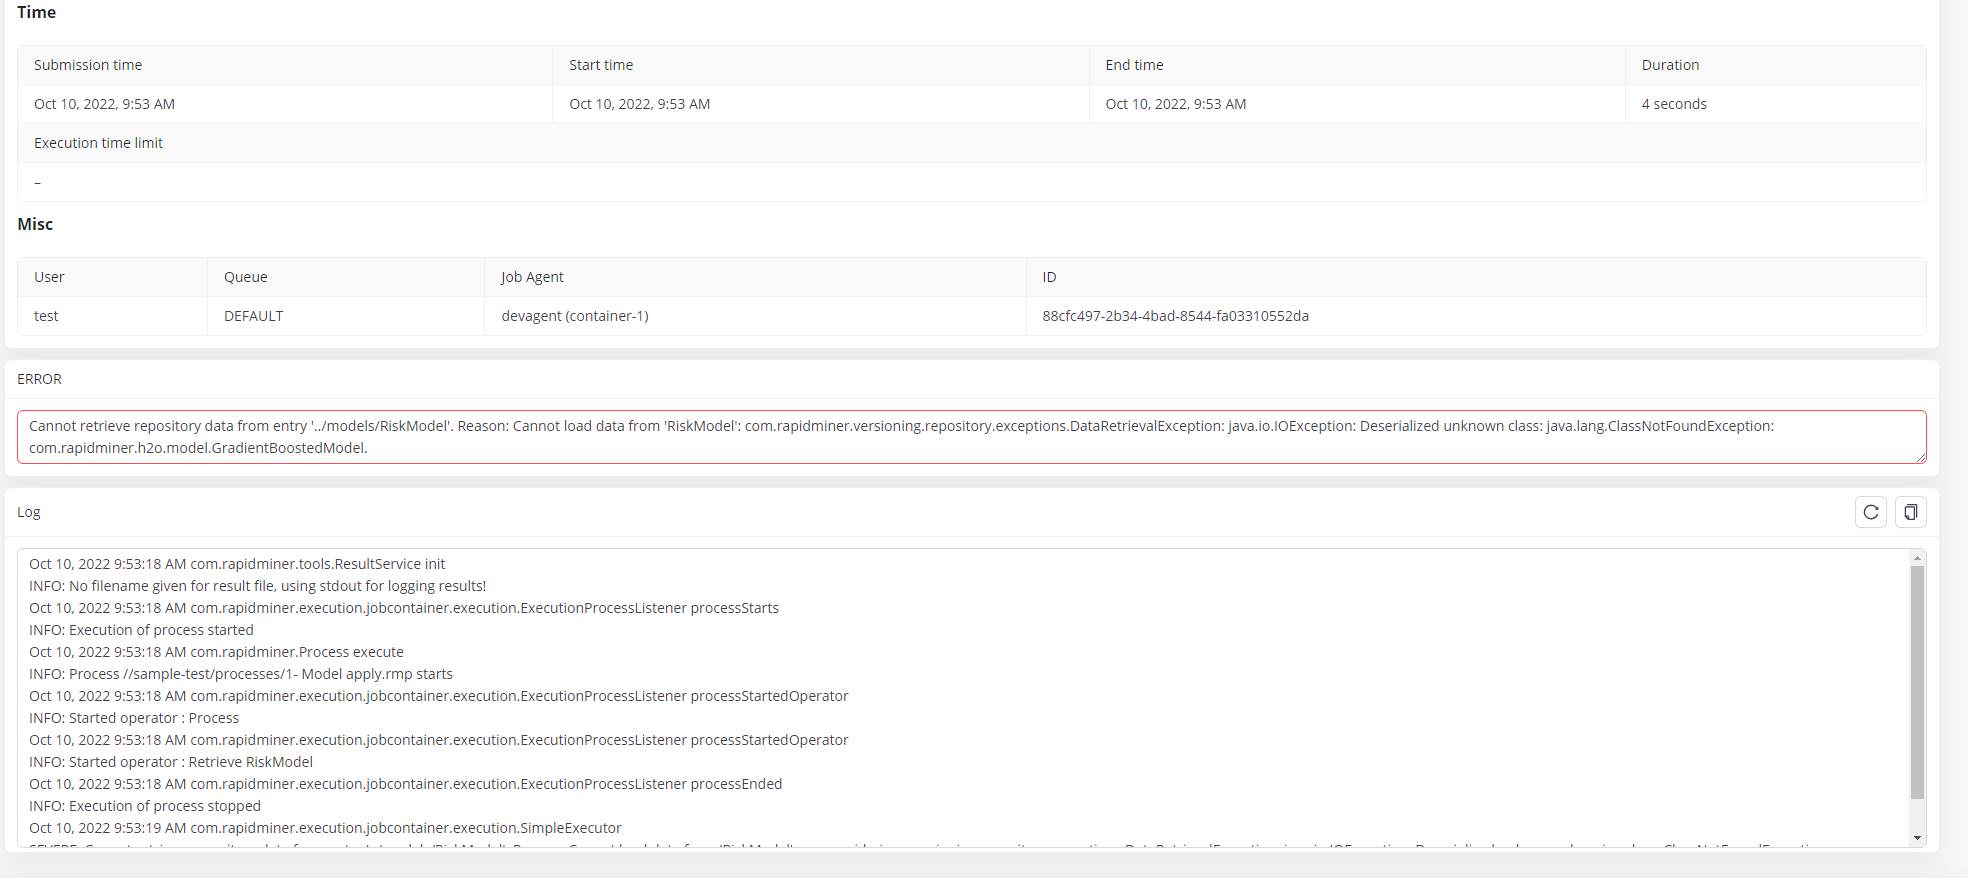
If you had an error while running the process you will get an Error section on the Process Execution Details page:

Viewing process execution logs from RapidMiner Studio
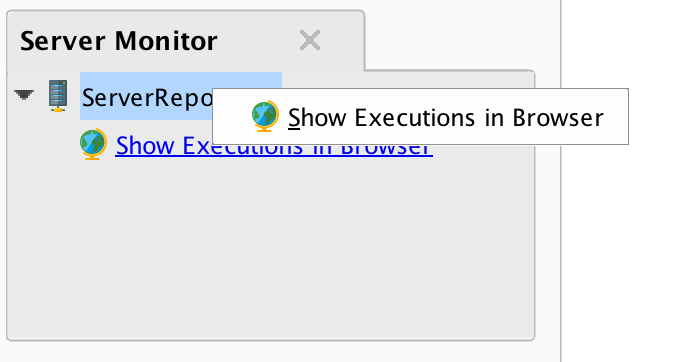
In RapidMiner Studio, use View > Show Panel > Server Monitor to open the list of servers panel. From there you can open up the web interface by clicking the Show Execution in Browser button or by right clicking the server and clicking Show Execution in Browser.

Viewing Job Container logs
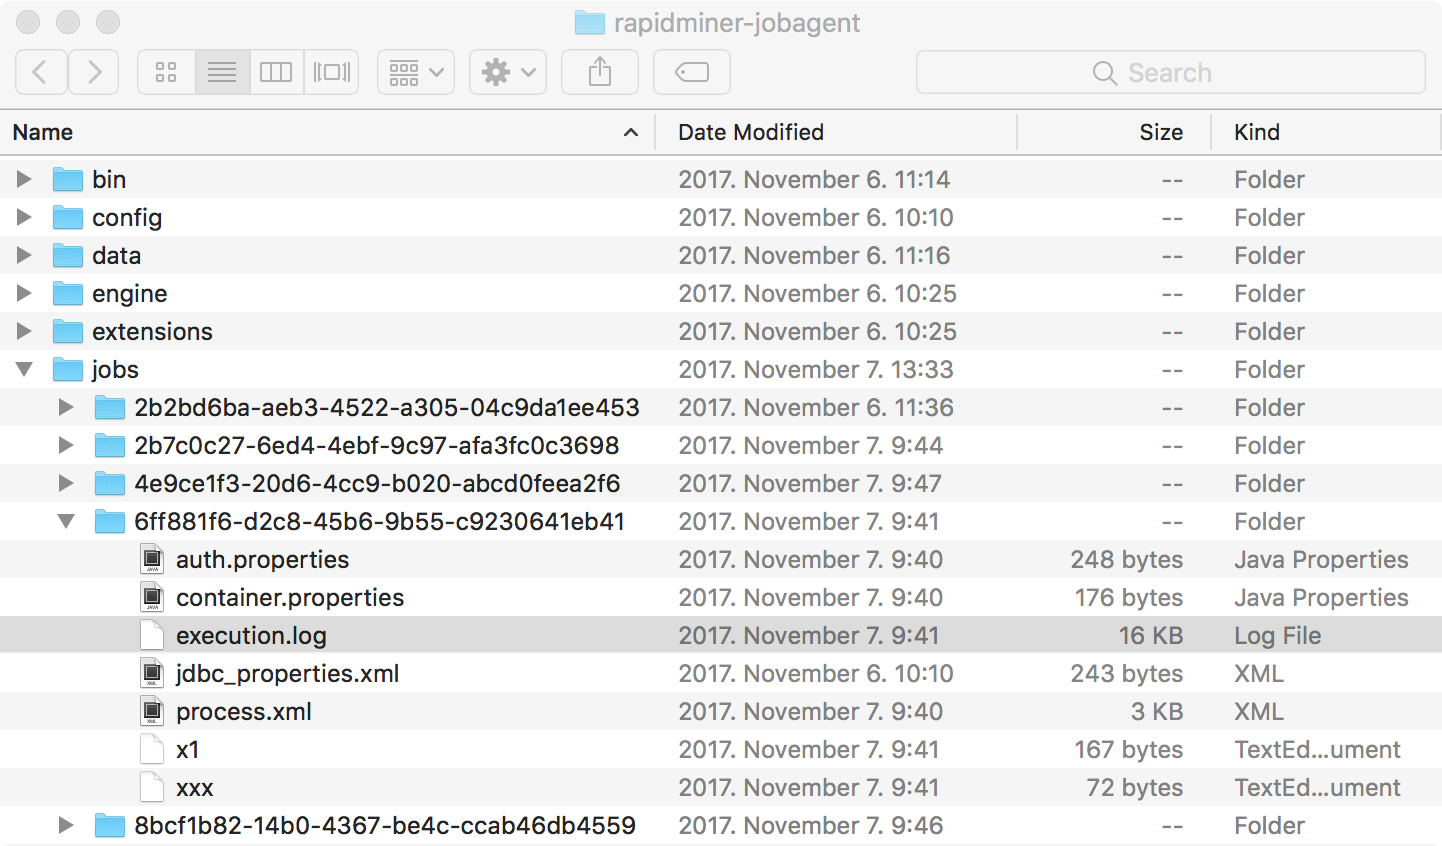
You can view the logs of a Job Container from the Job Agent folder under jobs/<job-id>/execution.log.

Advanced use cases
Radoop logs in Job Agents
To enable debug logging of Radoop in Job Agents, please follow these instructions:
- Adapt
rapidminer.propertiesinside the Job Agent's home directory under$jaHome/config/rapidminer/rapidminer.properties - Add or comment out the
rapidminer.radoop.log4j=trueproperty to enable debug logging - Adapt the Job Agent's environment variable
JOBAGENT_CONTAINER_JVM_CUSTOM_OPTIONS="-Dradoop.debug.pool=true -Djava.util.logging.SimpleFormatter.format=%1$tF %1$tT,%1$tL %1$tZ %4$s %2$s: %5$s %6$s%n"
Related execution logs will now contain more information related to Radoop.