You are viewing the RapidMiner Go documentation for version 9.5 - Check here for latest version
Binary classification
Jump ahead to the Example: Churn Prediction Data
Performance metrics
Before you can decide on a performance metric, we need to introduce some terminology, and then you need to decide on your relationship to wrong predictions -- not all wrong predictions are created equal! Assume your target column has only two possible values; we'll call them positive and negative.
- positive value - of the two values, the value you chose to focus on
- negative value - of the two values, the value you chose not to focus on
When we apply our binary classification model to the test set, each prediction will be positive or negative, and right or wrong, compared to the known value. We can summarize the possible outcomes in the so-called confusion matrix:
| Actually negative | Actually positive | |
|---|---|---|
| Predicted negative | TN = true negatives | FN = false negatives |
| Predicted positive | FP = false positives | TP = true positives |
Notice that there are two kinds of wrong predictions: false positives (FP) and false negatives (FN). While both are wrong, you will frequently find that one of the two is more disturbing than the other, and you will choose your performance metric to lessen its impact.
All performance metrics for binary classification models are based on combinations of the four values TP / TN / FP / FN. RapidMiner Go provides the following metrics:
| Performance metric | Formula | Description |
|---|---|---|
| Accuracy | (TP + TN) --------- (TP + TN + FP + FN) |
the ratio of correct predictions to the total number of predictions. If you're neutral in the question of false positives versus false negatives, choose the model with the highest Accuracy. |
| Classification Error | (FP + FN) --------- (TP + TN + FP + FN) |
the ratio of incorrect predictions to the total number of predictions (= 1 - Accuracy) |
| Precision | TP --------- (TP + FP) |
the ratio of true positives to all positive predictions. If you want to minimize the number of false positives, choose the model with the highest value of Precision. |
| Recall | TP --------- (TP + FN) |
the ratio of true positives to all positive values. If you want to minimize the number of false negatives, choose the model with the highest value of Recall. |
Now let's make this somewhat abstract discussion more concrete.
Case 1: An expensive marketing campaign (selective search)
Suppose that you are running a marketing campaign, and your machine learning model is tasked with targeting customers who will respond positively. Because the campaign is costly, involving direct communication with each customer, you want to be relatively sure of success; you don't want to waste time and money contacting people who aren't likely to be interested. In short, false positives are undesirable, whereas false negatives are acceptable. It's not important to identify every customer who is likely to be interested. Hence, you choose Precision as your performance metric, because a high value for Precision implies that there are few false positives -- people identified by the model as interested, who in reality aren't.
Case 2: An inexpensive marketing campaign (exhaustive search)
Suppose your machine learning model is tasked with finding customers who are likely to churn. These customers will get a special offer to convince them to stay. The special offer is relatively inexpensive, relative to the cost of losing a customer, so the emphasis is on finding all the potential churners. In short, false negatives are undesirable, whereas false positives are acceptable. There's no harm in contacting a few extra people. Hence, you choose Recall as your performance metric, because a high value for Recall implies that there are few false negatives -- people not identified by the model as churners, who in reality are.
Case 3: Fraud Detection
In the first encounter with performance metrics, you may be tempted to choose Accuracy as your performance metric, because it is more familiar than Precision or Recall. While Accuracy is, in general, the most common performance metric in data science, it is not always the best metric to use, especially when positive and negative predictions have dramatically different implications.
Suppose you are looking for fraudulent transactions. Most transactions are not fraudulent; instances of fraud are rare. For the purposes of this example, let's assume that only 1 transaction out of every 10,000 transactions is fraudulent -- a rate of 0.01%. Now suppose we have a ridiculously simple model to predict fraudulent transactions: it always predicts "no fraud"! Notice that this simple model has an Accuracy of 99.99%, because 99.99% of all transactions are not fraudulent. Nevertheless, if it is important for you to uncover fraud, you will reject this model immediately, despite its high Accuracy, because the model gives you no hint where to look.
Clearly, you don't want false negatives -- you want to discover all the instances of fraud, if possible. But you also need to worry about false positives, because you don't want to falsely accuse innocent customers. The best approach is probably to use Recall for your model, to avoid false negatives, but then to take additional steps to avoid wrongful accusations. For example, you might contact the customer, say that the transaction was unusual, and ask for details. An honest customer will probably be grateful that you are protecting his interests.
Example: Churn Prediction Data
Model Comparison
Step 5 of RapidMiner Go presents a Model Comparison. The Model Comparison includes a summary performance table, where each row represents a model and each column a performance metric. Here you can quickly determine which model best satisfies your requirements.
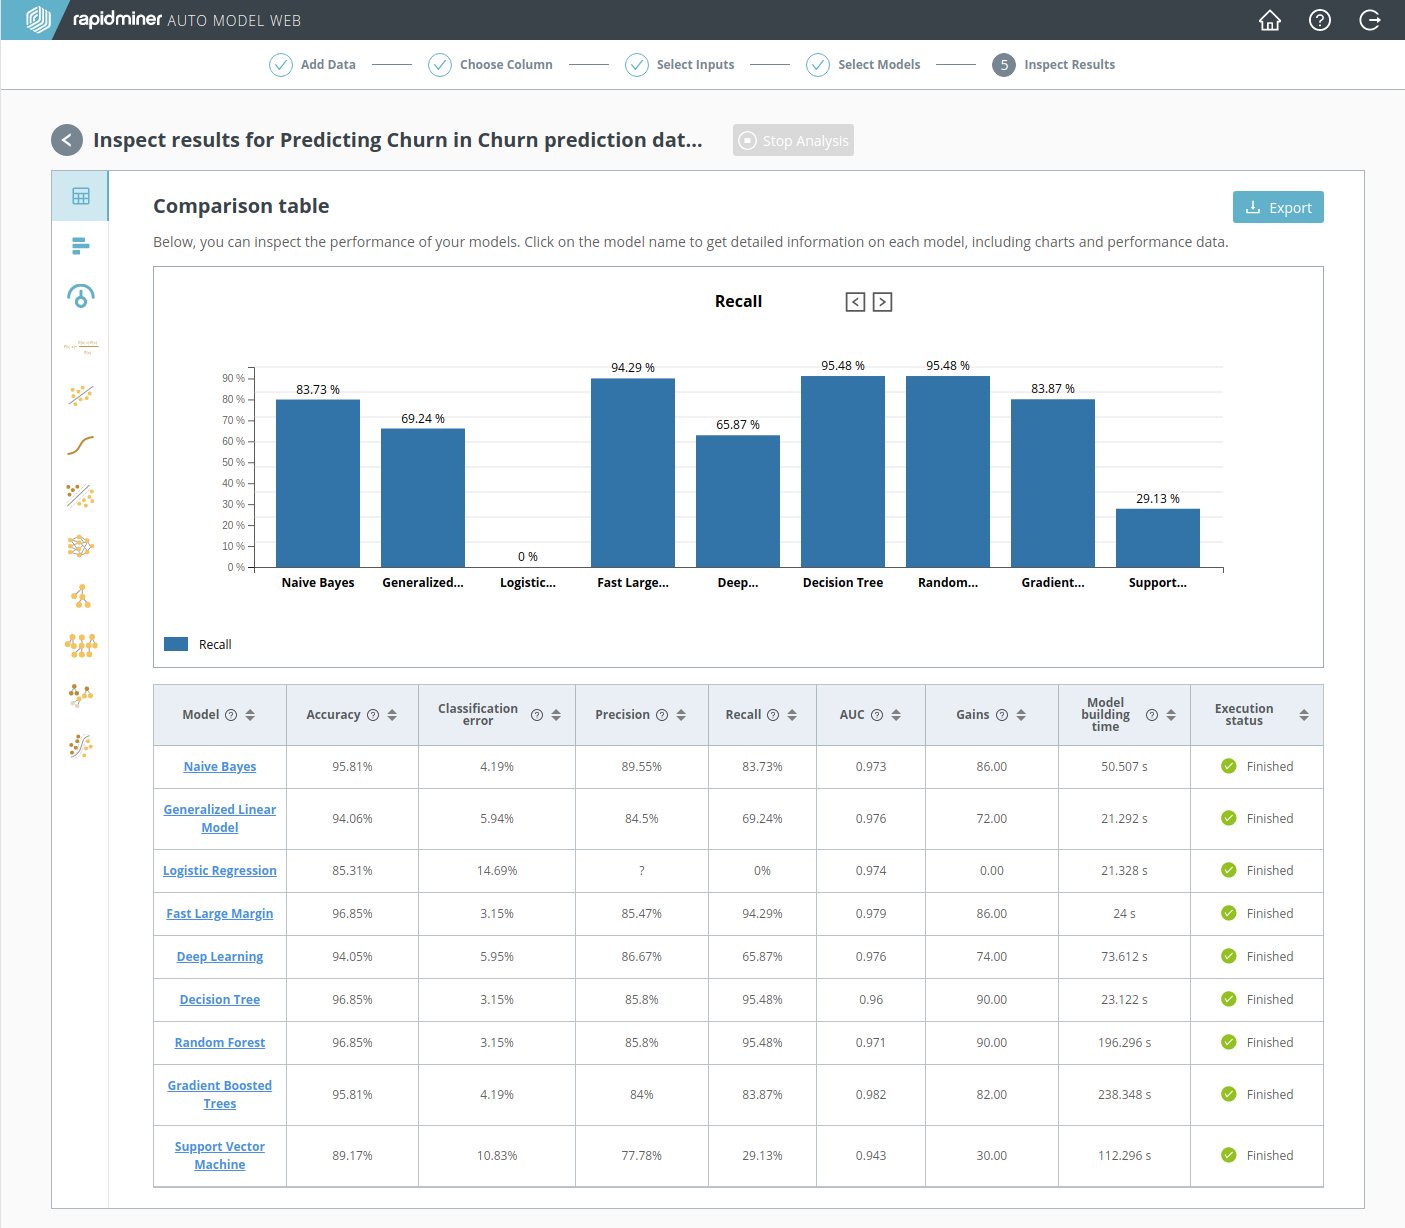
For the reasons discussed above in An inexpensive marketing campaign, Recall is the best performance metric for our Churn problem. Notice that the highest value of Recall is obtained by two models: Decision Tree (95.48%) and Random Forest (95.48%).
Although the Accuracy of Fast Large Margin is just as good as the Decision Tree, we don't care. Our goal was to find all the potential churners, and the best way to do that is to choose the model with the highest Recall, even if it means that we will be contacting more people than necessary.
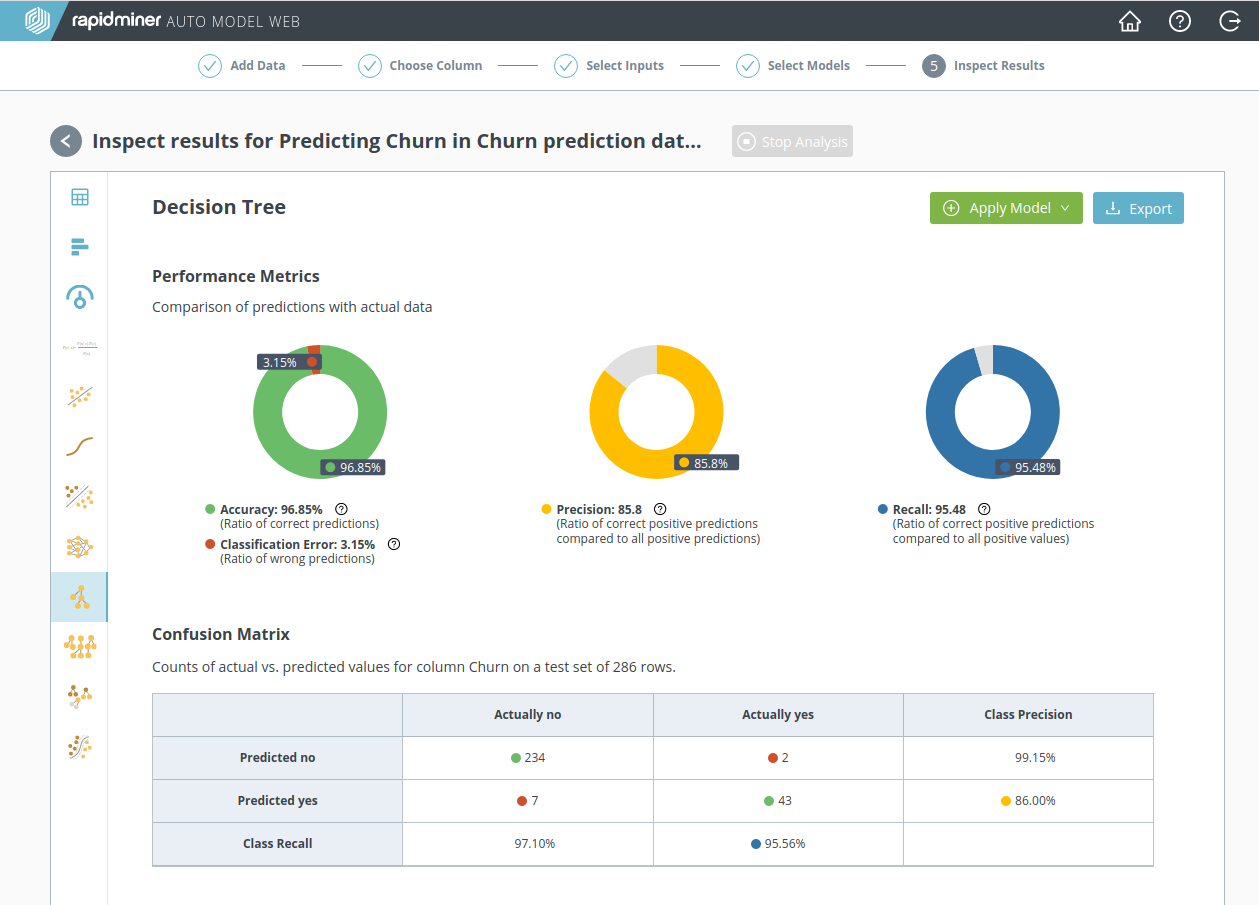
Decision Tree
By clicking on Decision Tree, we obtain additional information, including a more detailed look at the performance statistics:
and a very simple explanatory scheme at the bottom of the page:
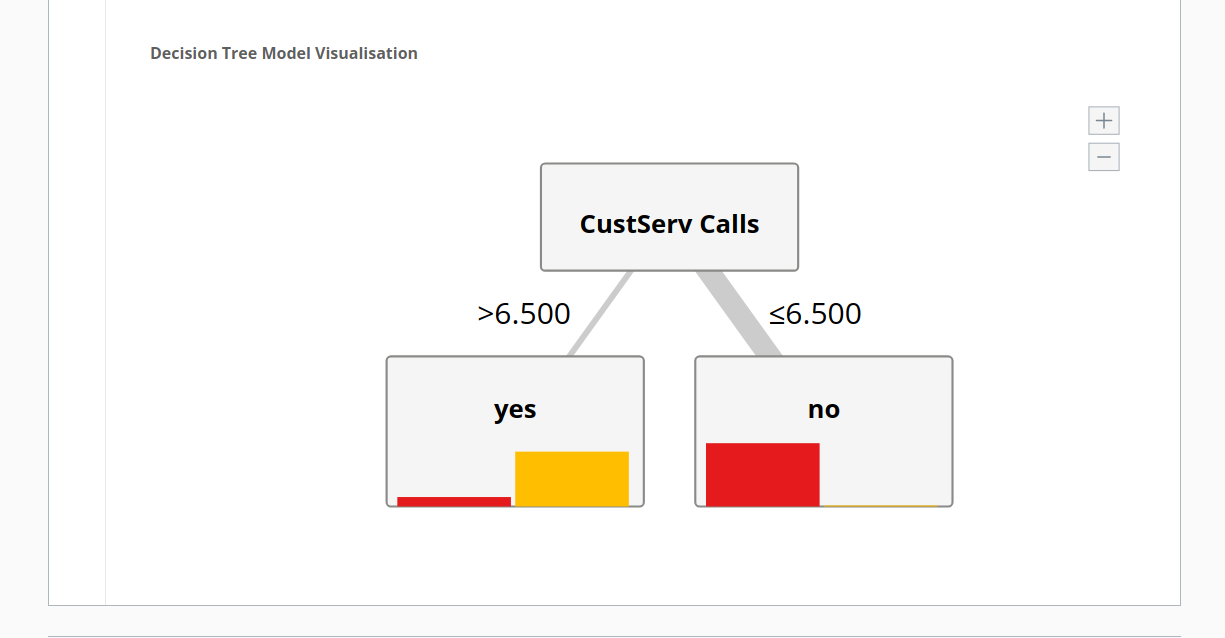
Each branch of the tree asserts a condition on the data above it. Here, the two conditions are that the number of customer service calls is 1) more than 6.5, or 2) less than 6.5. The conclusion, in words, is the following:
- customers do not churn ("no") if they make fewer than 6.5 calls to customer service
- customers are highly likely to churn ("yes") if they make more than 6.5 calls to customer service
Not every model is this simple! But if you think back to the discussion at the end of Step 3: Select inputs, you should not be surprised. There it was said that there is a strong correlation between churn and the number of calls to customer service, as the model now clearly demonstrates.
A recalculation: without the customer service call data
It sounds like a bad idea, but suppose for a moment that we had excluded the column "CustServ Calls" from our data. Would the performance of our model have been affected? A quick glance at the screenshot below, based on a recalculation with this data excluded, shows that the effect on model performance is devastating. No model has a Recall higher than 50%. Without the customer service call data, we can't find the churners.
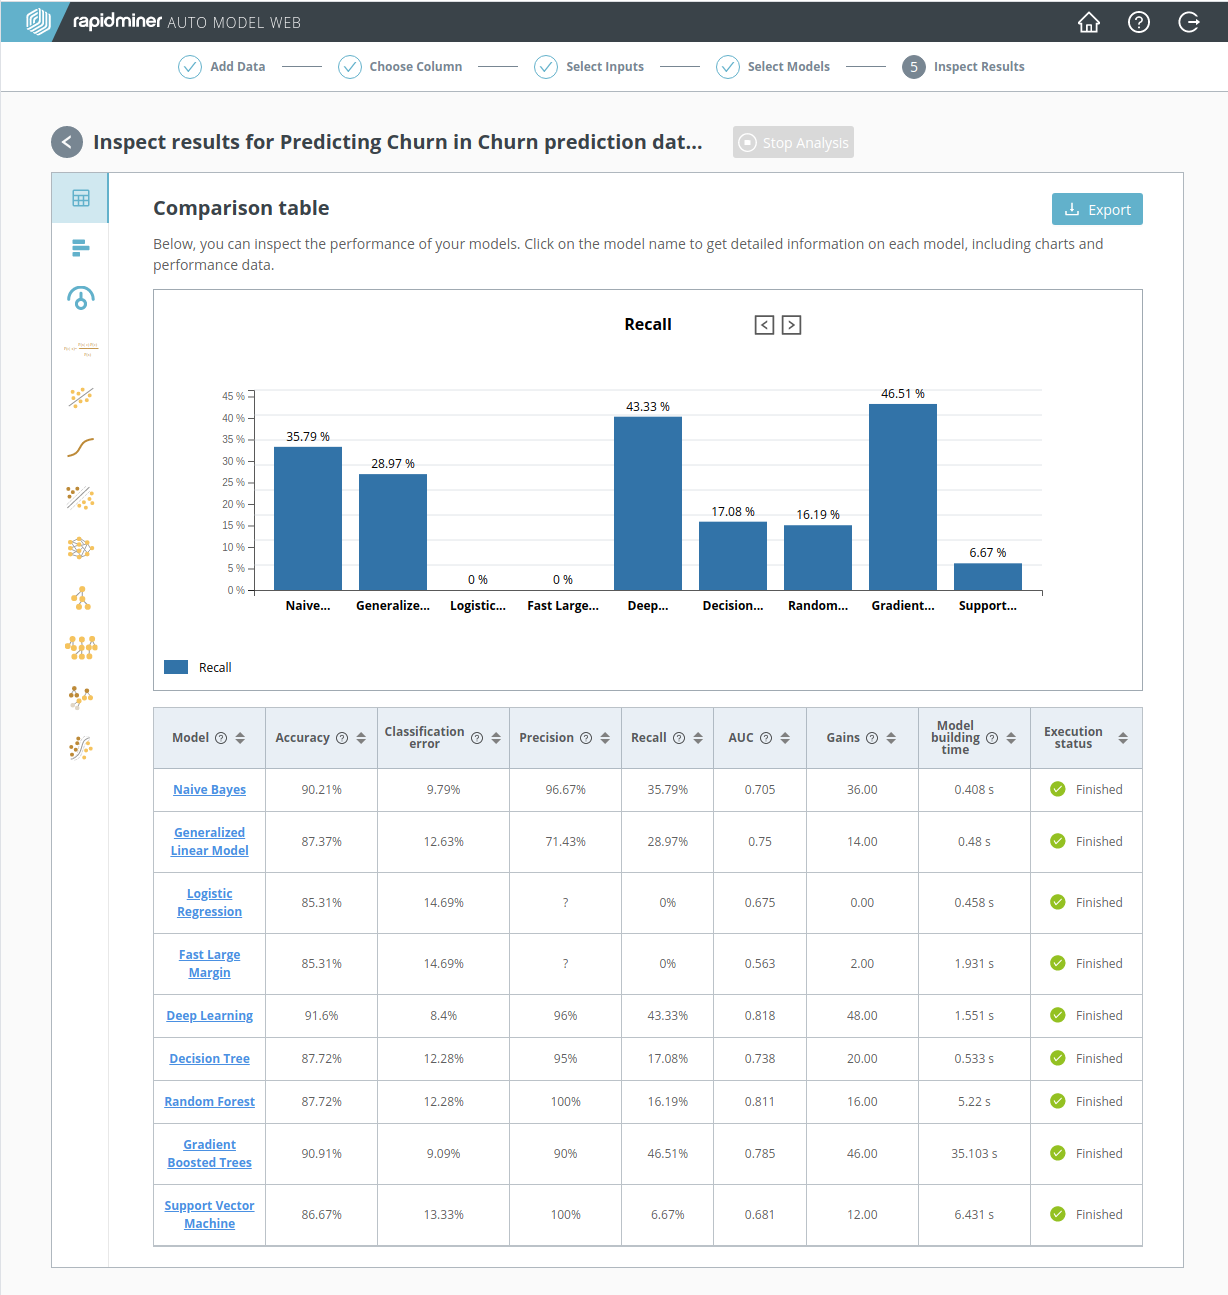
This recalculation, despite its failures, makes a useful point that applies to data science in general: relevant data is alpha and omega. You cannot compensate for poor quality data with a clever model or a fancy performance metric. Make sure you have good data.
Summary: have we succeeded?
If you include the "CustServ Calls" data, you get a superior model, using Recall as your performance metric, but if you attempt to make black-box predictions with this model, you are likely to be disappointed.
Why? Because by the time the customer has made so many phone calls to Customer Service that the model identifies him as a churner, it will be too late! This point takes us back to the original question: will I have access to the data in the highly-correlated column prior to making a prediction? Although originally we said yes, now the answer looks more like no!
It's time to take a step back and acknowledge that the software by itself won't solve all our problems. For a moment, let's forget about data science and concentrate on the business objectives. Here are the essential questions:
- Why are customers leaving the phone company?
- What can the phone company do to convince customers to stay?
What do we know? Thanks to the models, we know that customers who make too many calls to Customer Service are highly likely to churn. But the number of phone calls is only a symptom; it doesn't answer the question "Why are they leaving?" Important information is still missing.
Notice that the content of the phone calls to Customer Service is not included in the data set. We need to ask Customer Service to log their phone calls and to categorize the complaints. With a new and improved data set, perhaps we can answer the "why" question. It's too early to declare success or failure, but at least our analysis has gotten started!