You are viewing the RapidMiner Server documentation for version 8.2 - Check here for latest version
How to create Web Apps
This is a general introduction to building Web Apps, using the Titanic dataset. The Titanic data set is bundled with RapidMiner Studio, in the repository.
If you have already created a Web App for RapidMiner Server, and you need high throughput – fast predictions and low latency – please read about RapidMiner Real-Time Scoring.
The scope of Web Apps
RapidMiner Web Apps are one of the ways to present results to end users. Web Apps are web interfaces where users can see, explore, and change the data. They can also trigger RapidMiner processes to update the results.
Web Apps are heavily connected to RapidMiner processes. In fact all the logic in a Web App is defined in RapidMiner processes. This tight integration allows the Web App designer to give a variety of in-depth analytical options to the end user. In particular, the end user does not need to have RapidMiner Studio.
The general concept of Web Apps
As mentioned before, one key concept of RapidMiner Web Apps is that all logic is defined in RapidMiner processes. The way you interact with the dashboard is by publishing objects (mostly tables or documents) to the server. The RapidMiner Server comes with two important operators for Web Apps. Publish to App and Recall from App. Those operators allow for publishing any object that can run through a connection in RapidMiner Studio to a Web App. The Web App itself is simply a visualization of these results.
Furthermore, Web Apps allow end users to interact with published results. Interactions in a Web App simply trigger other RapidMiner processes that might generate new data, recall App objects, or update App objects. Every time an object is published or updated, all depending visualizations will be updated.
In order to be able to construct Web Apps you should be familiar with:
- The Execute Process operator
- Macros
- ETL functionality
- Advanced operators like Branch and Handle Exception
Because you will use those things heavily.
Be aware that all published apps are session aware. This means that all app objects you create in your Studio only live in your Studio. If you create objects in a Web App they only exist in this session. Not for other users. They also are not available if you relogin into the web interface. Another thing to note is, that processes which are triggered by a schedule process operator are not in the same session.
Building our first Web App
In this tutorial we will build a small Web App based on the Titanic data set. This Web App can be seen as a "hello world" Web App showing basic functionality. There are a lot of advanced functions possible by interacting with common web techniques (JavaScript, CSS, XSLT) or by creatively using RapidMiner processes (connections to Cloud Services, Web Mining, Databases etc.)
Some general comments
To do our example we first need to create a folder on Server. As a best practice we at RapidMiner recommend a folder structure like this for all projects:
app– contains all processes for the appdata– contains all the datadebug– containing debug data and processesprocesses– contains all processes for the actual data analysis, e.g., modelingsubprocesses– if needed, you can use functions you call in the main functions here.results– performances, models etc. In big projects it might be useful to have a separate models folderwebservice– processes which can be accessed via web services
After this we need to upload the Titanic data (all three) from the Sample directory over to our server (right click copy, right click paste). This way we ensure that the server itself has the data set. Please be aware that the server has only access to objects in its repository and to objects available via shared connections. In order to use a database on Server and on Studio you need to define the connection on server and share this with your Studio.
Creating an app
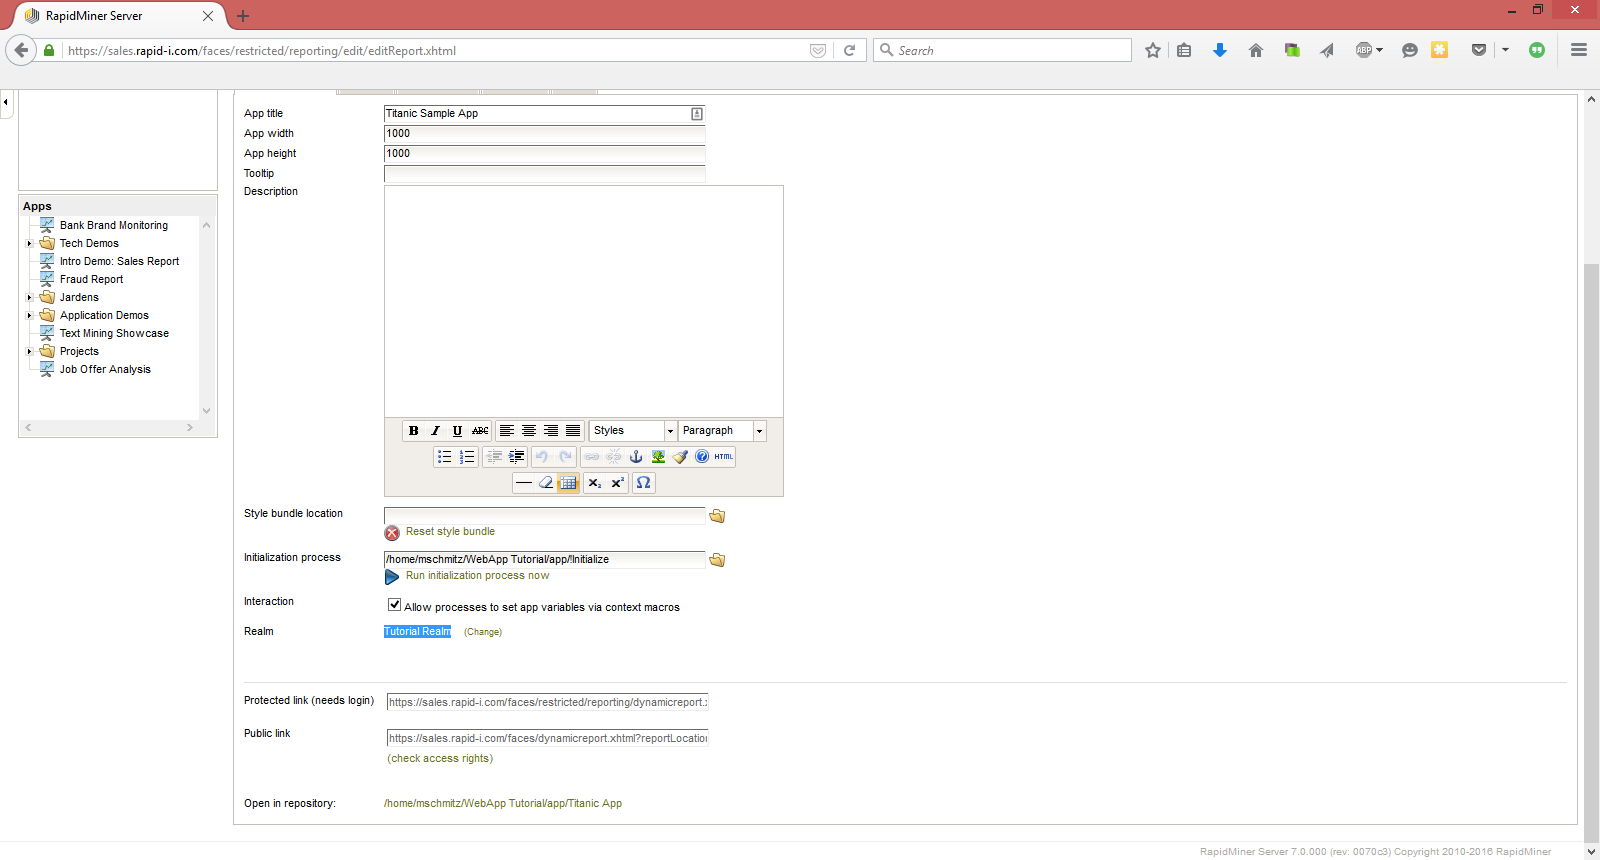
After uploading the data we will create the Web App in the web interface of the server. To do so go to the ip address of your server and log in. Afterwards you can switch to the Web App designer by clicking on the link on the left. Click on New App to create a new app.
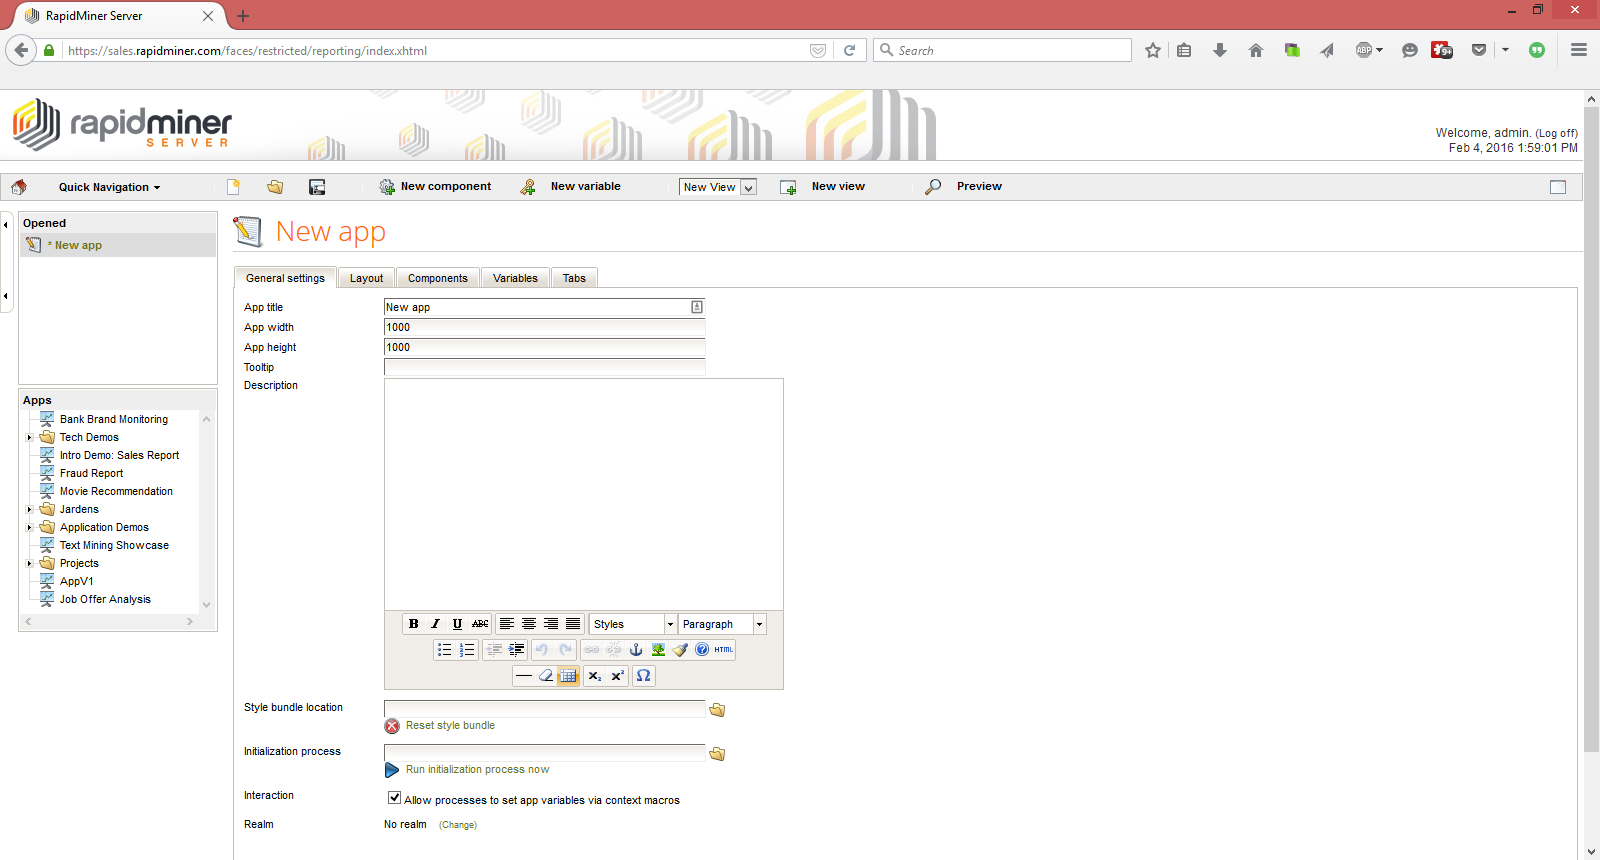
The screen above is the main screen to develop a Web App on the server side. Please store the app first by clicking on the small disc in the upper panel. The common place for the web-app is in the app folder of your created project. Be aware that there is no auto safe in the Web App designer. It is recommended to save often. You can also set a name of the app in the top of the interface.
The initialize process
One main thing in a Web App is the so called initialize process.
This process will be executed if you open the Web App.
This process is usually a meta process with several Execute Process operators.
This process takes care of publishing all app object so they are available in the app if it opens.
As a general convention this process is called !Initialize and is located in the app directory.
Please create an empty process like this in your app folder.
Add this process as initialization process in the main Web App interface.
Make sure to save your progress.
A table
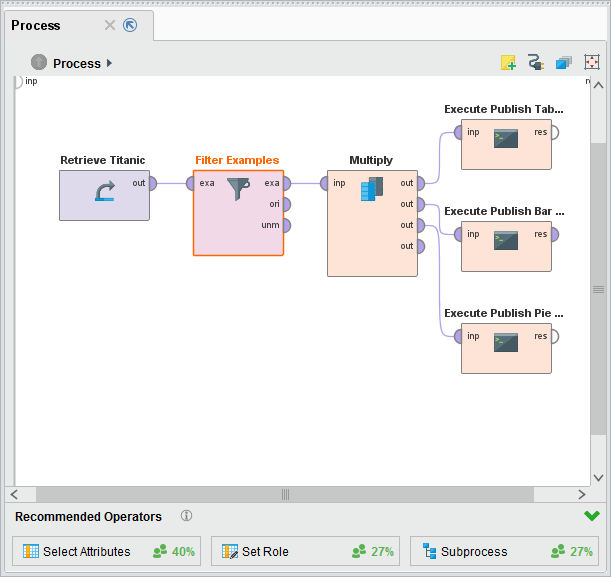
Let's start with a table. To do so we need to publish the data in a process first. Please create the process first and safe it. The name could be Publish Table Data. The process should retrieve the Titanic Training Data and connect this into a Publish to App Operator. Be sure that you use relative paths in the Retrieve operator. Absolute paths can not be used on RapidMiner Server.
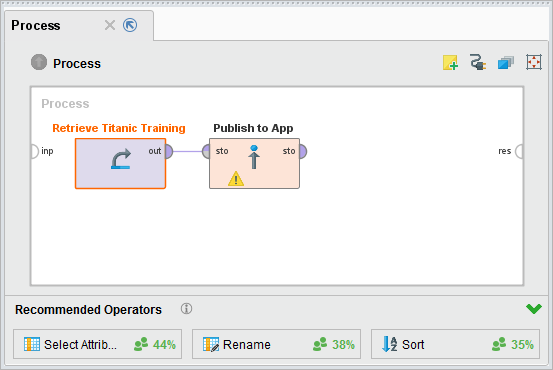
We need to configure a name in Publish to App.
In bigger apps it is common to publish a lot of app objects.
It is common to prefix the app objects with the tab (we will discuss this later on) they will be displayed in.
In our case we might use Main::TableData. For global app objects you can use ::TableData.
This process is already enough to display the table.
But this object needs to be built in the Web App for the user.
To do this you need to add this process as an execute process to the !Initialize process.
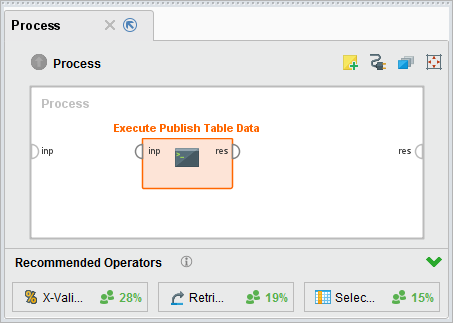
Be sure to save this process. We are now done on the Studio side. Let's move to the server. Please rerun the initialization process by clicking on the blue arrow right next to the location of initialization process. After doing so move to the Layout tab. In this tab we can arrange different visualization components. The components of a dashboard are available by clicking on the New component button in the upper panel.
Please add a New Visualization to the app. You can resize the component with the small triangle on the lower right. To edit the visualization you can hoover over the object and click on the edit button in the upper right.
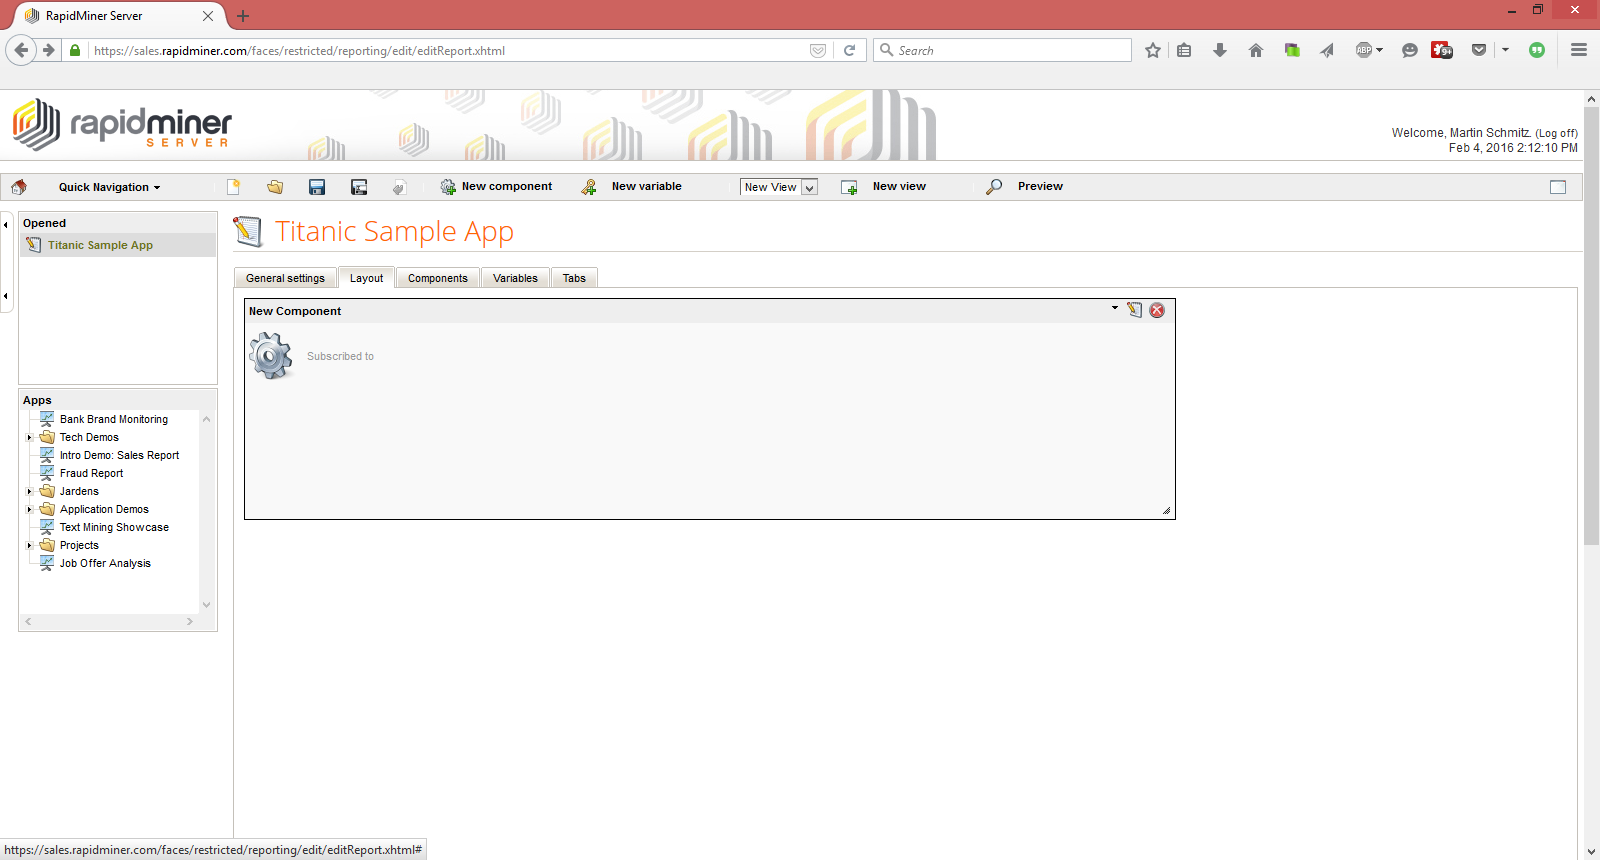
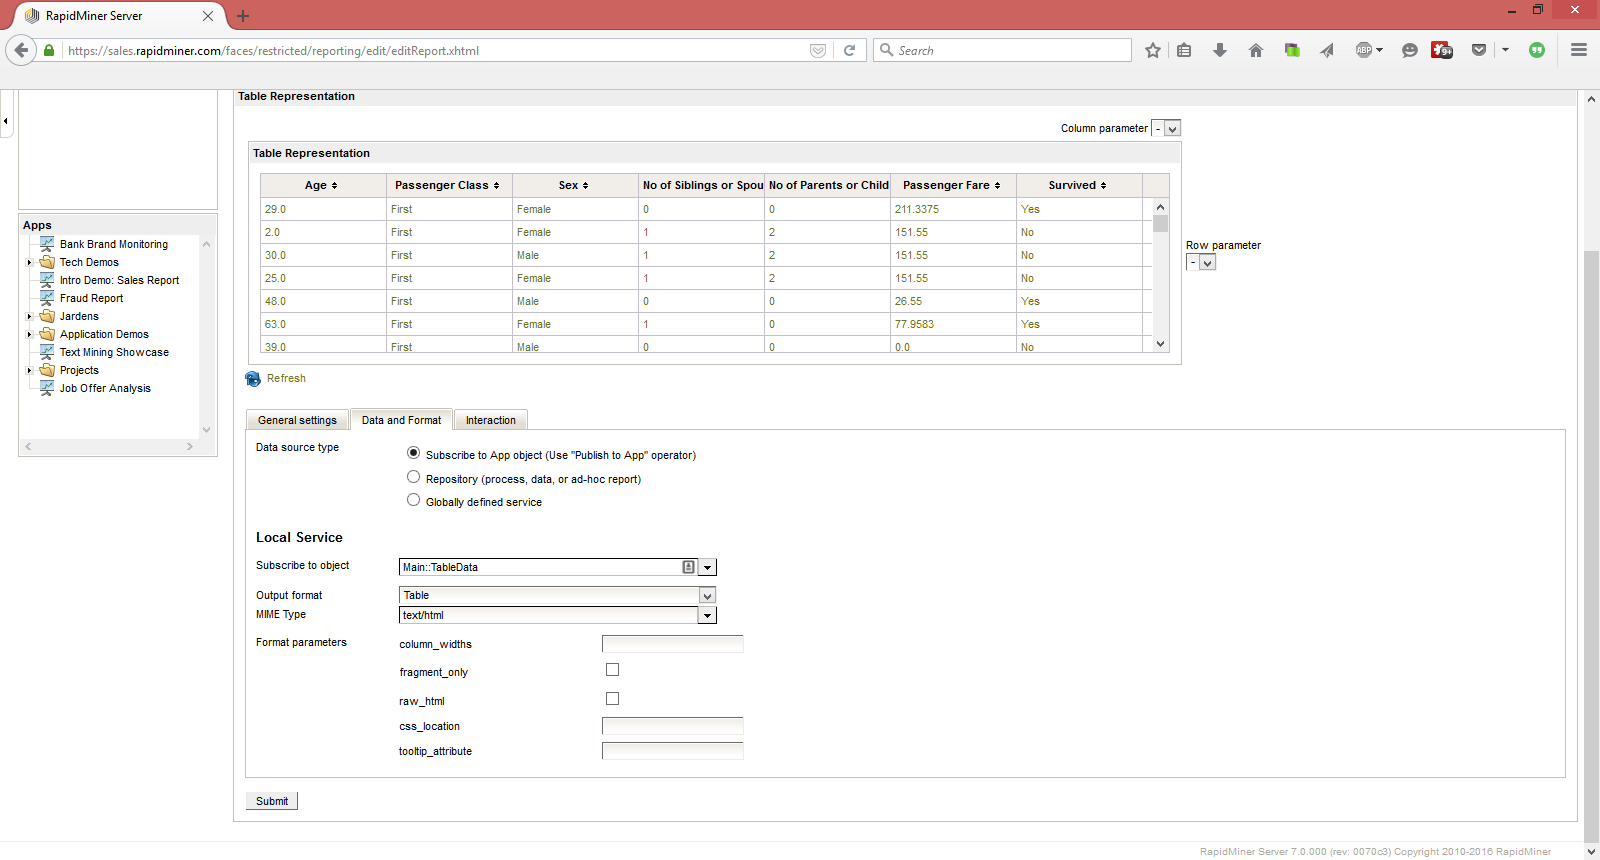
Let's rename the object first to Table Representation. Afterwards we can move to Data and Format to configure the visualization.
First subscribe to the object we jut published by setting Subscribe to object to Main::TableData.
Afterwards we need to configure how the data should be displayed.
In our case this will be a simple table. So please choose Table as output format.
You can get a preview of your visualization by clicking on the Refresh button.
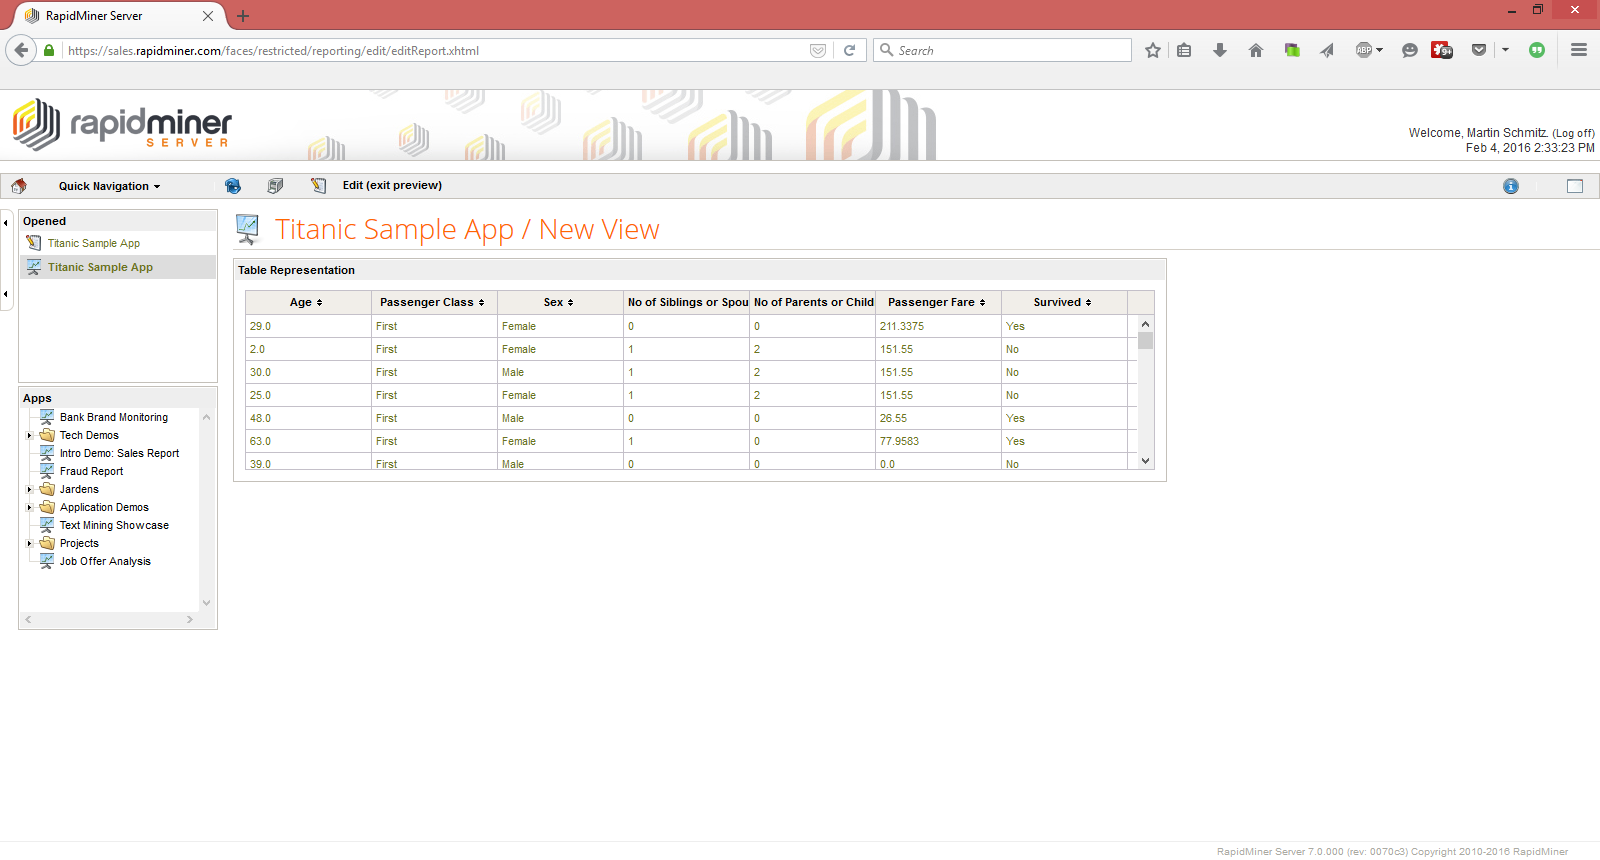
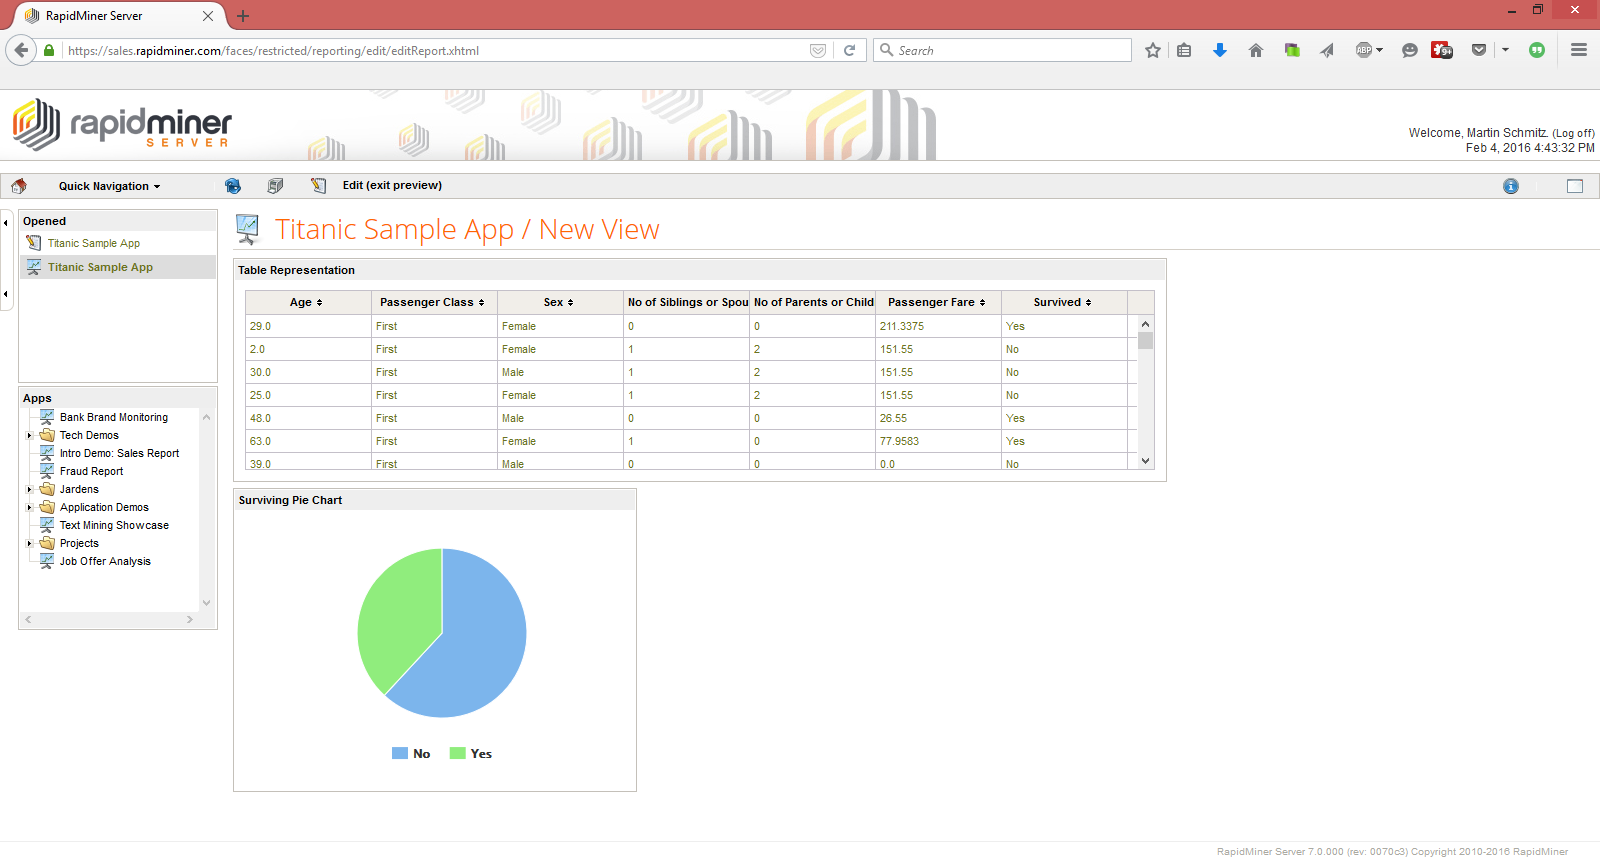
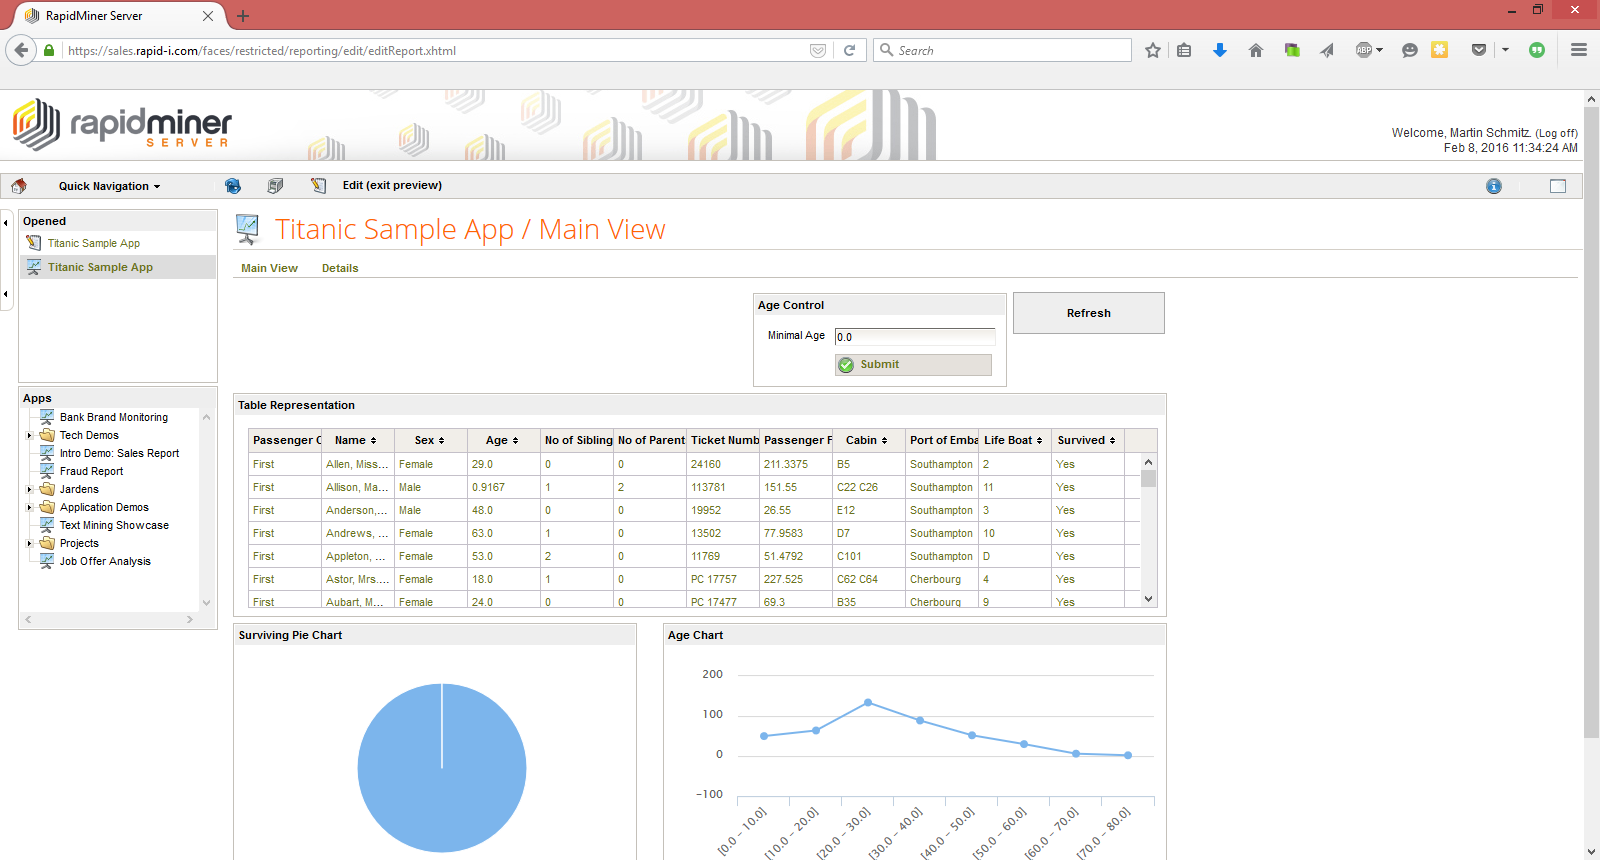
After submitting the changes and saving the progress, we can move to the preview by clicking on it in the upper panel. The result should look like this:
If you would like to remove columns, or reorder them you would do this in the RapidMiner process (with Select Attributes and Reorder Attributes)
The used table option offers nice features like sorting in a table.
For bigger tables you will experience longer render times.
To avoid this you can use plain HTML tables and style them with custom CSS.
To do this you need to choose HTML as output format and provide a CSS.
We will cover this in a later session.
Visualizations – Pie Chart and Bar Chart
After building our first easy visualization, we can move on and do some more. We will start with a Pie chart, and move on with a Bar chart. Again the key idea is to do all the data prep in Studio and only visualize it on Server.
As a first step we would like to build a Pie Chart counting the number of survivors ands non survivors of the Titanic disaster. To do so we need to create a table like this in Studio
| Survived | Count |
|---|---|
| no | 567 |
| yes | 349 |
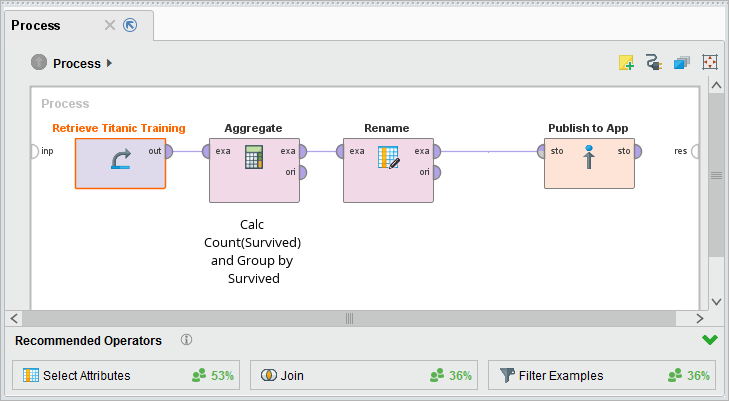
To do this we simply use an Aggregate operator that calculates count of Survived and groups by Survived.
For visual reasons we can rename count(Survived) to count.
The resulting table will be published to app as Main::PieChartData.
That's it again from the Studio part.
Let's move over to the Server interface to display it.
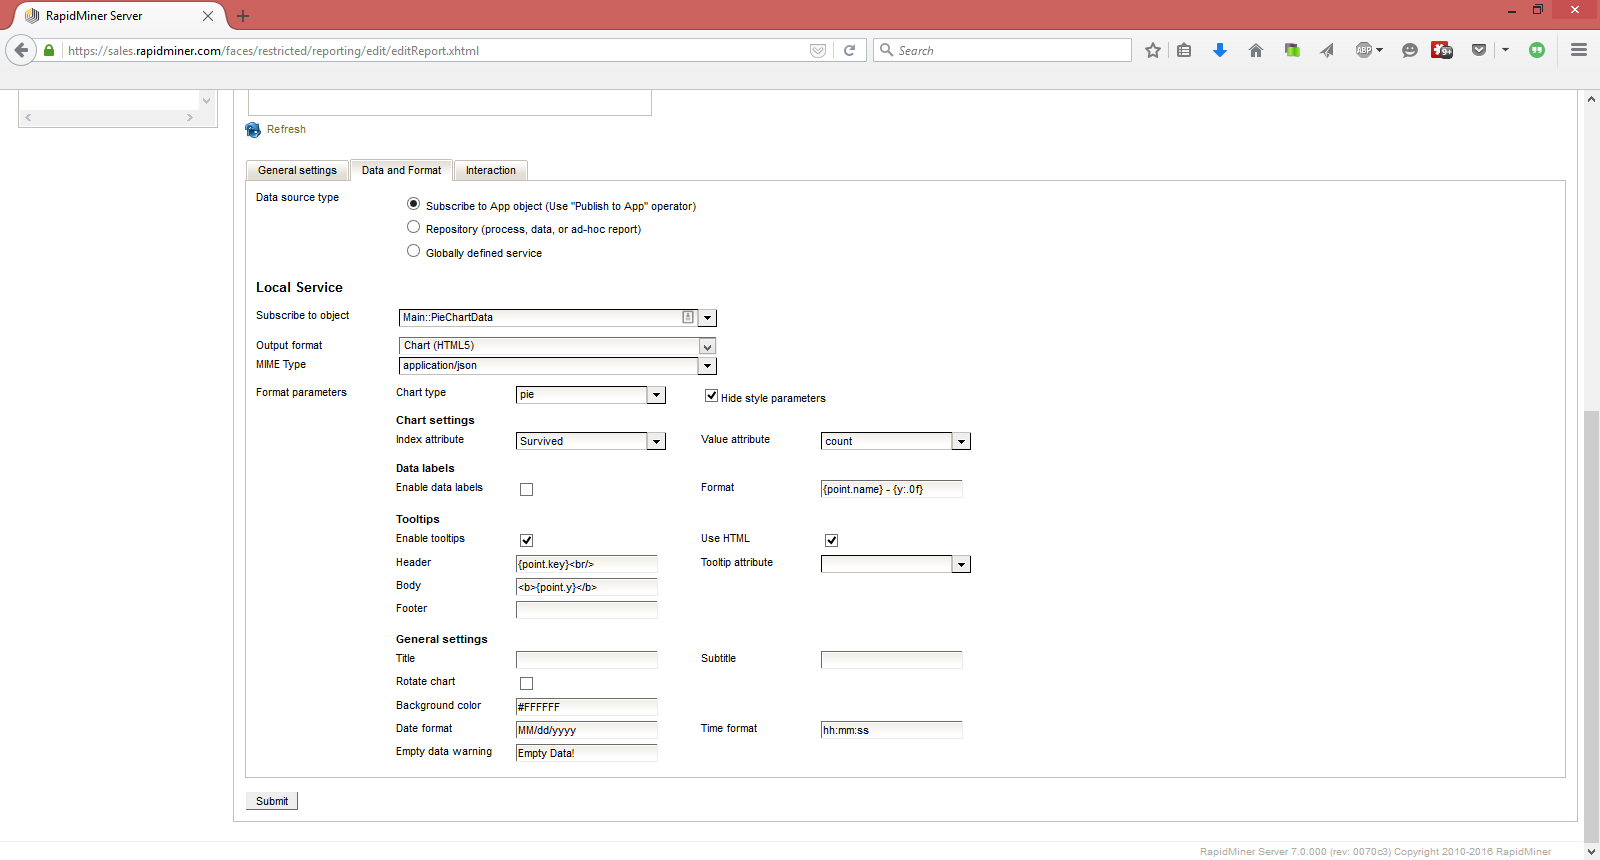
Create again a visualization, rename it and subscribe to the object Main::PieChartData.
This time we use a Chart (HTML5) as output format.
We choose pie as Chart type and use Survived as Index attribute and count as Value attribute.
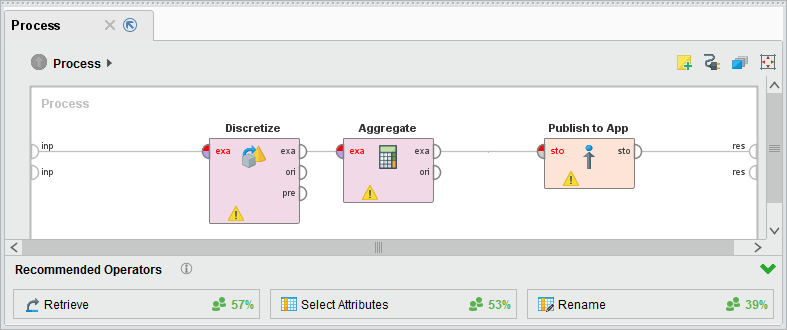
As a next quick step we would like to create a line chart of the Age attribute.
To do this we create a gain a process called Get Line Chart.
We can discretize Age first.
I recommend using Discretize by Binning and use 10 bins between 0 and 100.
Afterwards we aggregate with group by Age and count Survived again.
You can again rename count(Survived) to count using a rename operator.
Afterwards we publish this as MainView::CountByAge. The process for this looks like this
This can again be visualized.
Create a new visualization, subscribe to MainView::CountByAge and choose Chart type series and index attribute Age.
The result looks like this
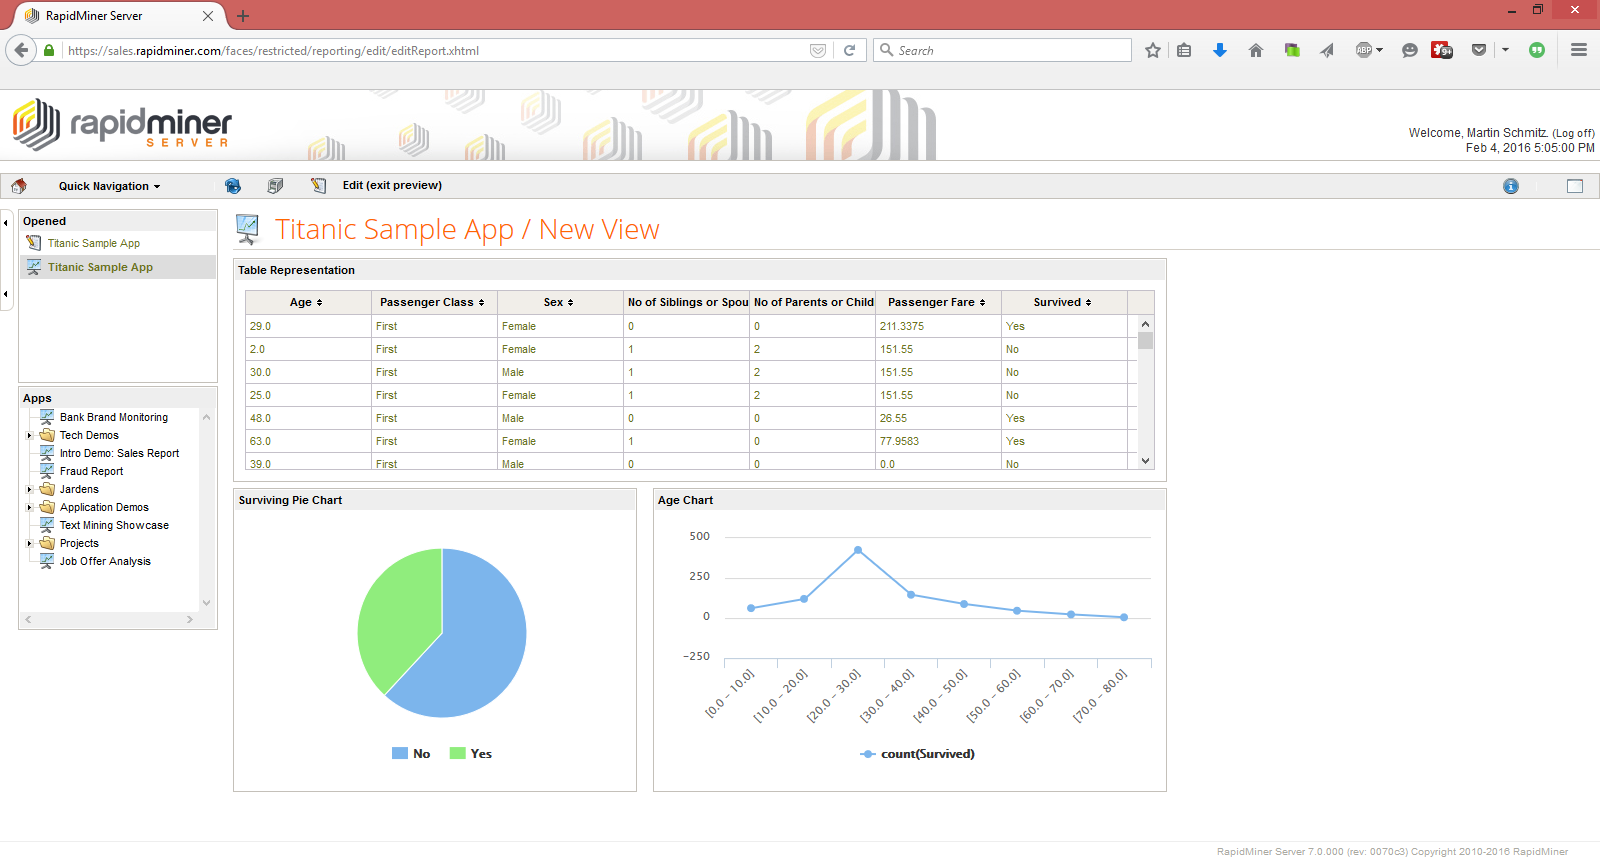
You now know about the general concepts of visualizations and can built static dashboards. In the next step we will focus on getting them more interactive
If you would like to have more then one line in the graph above, you simply need to group By more than one attribute. Afterwards you need to pivot the table, because RM Server expects a table like this
| Age | count_1 | count_2 |
|---|---|---|
| 10 | 2 | 3 |
| 20 | 5 | 1 |
Buttons
As a next thing we would like to add a button.
This button will refresh the data on our app.
This does not do that much in our case,
but it does in situations where we do not use a static data set but a database as data source.
To add a button go to the web front end and click on new component.
Choose a Button component in the dropdown.
Move to the edit menu, similar like editing a visualization.
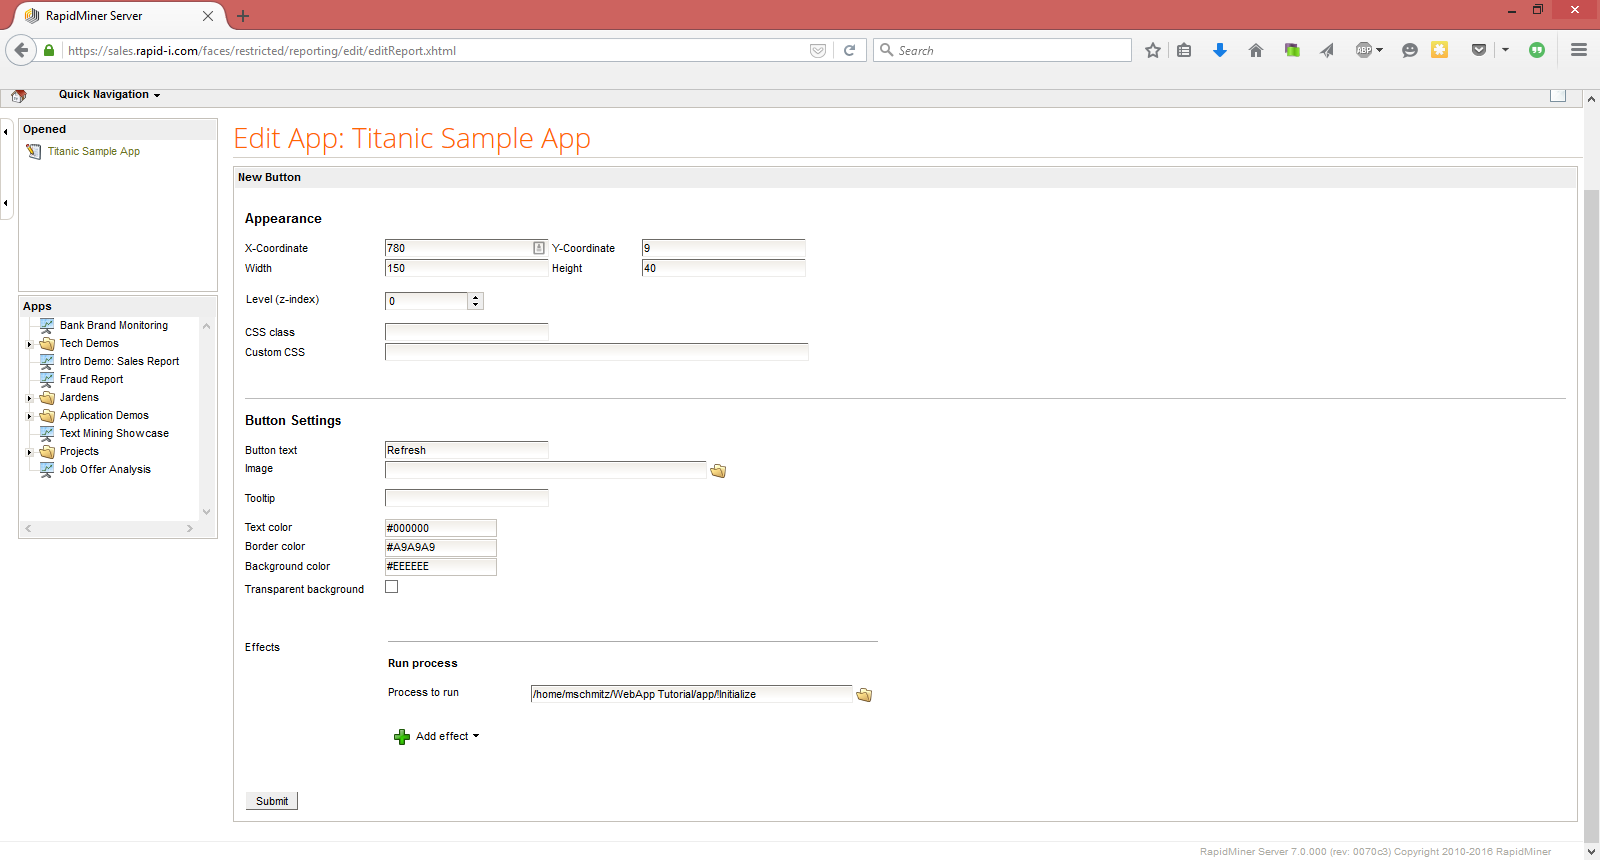
You can give the button a text (and if you want an image).
In our case the text will be Refresh.
You can add several effects to the click on the button.
A effect can be a trigger of a process, a change of an view (tab) or the setting of a variable.
In our case we will trigger a process. Please click on Add run process effect in the lower end of the Button menu.
Afterwards you can choose the process which should run after clicking on the button.
In our case this is the !Initialize process, which republishes all objects.
That's it.
Variables
Besides publishing (and recalling) app objects, there is a second way to pass information between processes and the web interface. While publishing is usually done with complex data structures (usually example sets or documents, sometimes also file objects) the concept of variables is on a primitive type level. Primitive types are: numbers, strings, dates and polynominals (classes). The underlying concept of variables is, that they are translated into process macros. By default variable values are implicitly handed over, if the process has a macro with the same name as the server variable.
Realms, Domains and Variables
In RapidMiner Server variables are instances of domains. A domain is a template for a data type. This template can be very different. Common examples are positive Integer, Text with an empty string as default, Date with a default date of 7 days before today etc. All those domains exists in so called realms. A realm is a project. Usually one realm is assigned to one Web App.
Creating a Variable
As a next step we will first create a variable and then use this variable to filter our main table.
We would like to create a variable called Age which is a positive Integer.
To do that we first need to create a realm.
To do that go to the upper left and choose Quick Navigation in the upper panel.
Please choose Manage Domains in the drop down. Afterwards click on the new button in the upper panel.
This will lead you to the generation dialogue for new realms
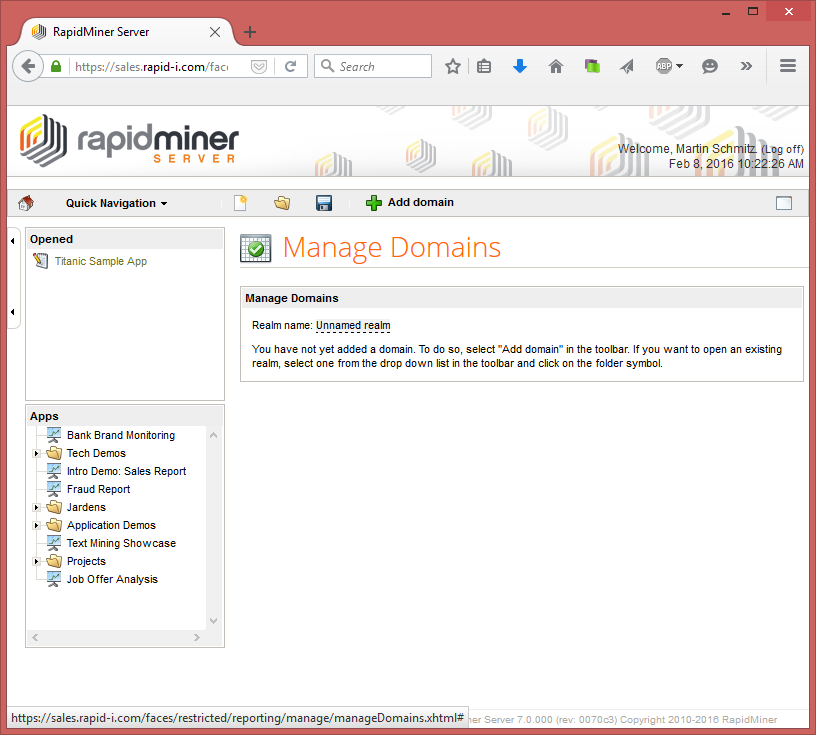
Give your Realm a name – I will choose Tutorial Realm – and save it. To add new domains, use to + button in the upper panel and choose the appropriate primitive type. In our case we will choose a number domain. We will create a domain called positive Integer, which can be used not only for age. The preset value is 0 minimal value is 0, maximum is 9999 and it is of course an integer. After creating the domain you can move back to the app by clicking on the app on the left panel and choose it.
Now we need to add the created realm to the app. That can be done in the general settings tab of our app.
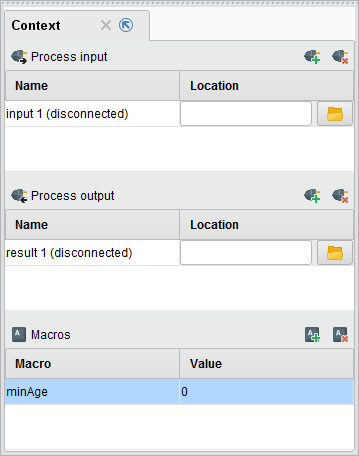
You can now switch over to the Variables tab and add a new variable.
This should be called minAge and has the display name Minimal Age.
The first one is used internally and is the name of the corresponding macro.
The later one on the other hand is the name which will be displayed to the user.
The domain is of course positive Integer.
Be sure to safe the app.
From time to time it happens, that a newly created domain is not available in the drop down for domains. A relogin into server solves this issue
There is the best practice to use camel case with a leading small letter for macro names. So it is myMacroValue. This also applies for server variables.
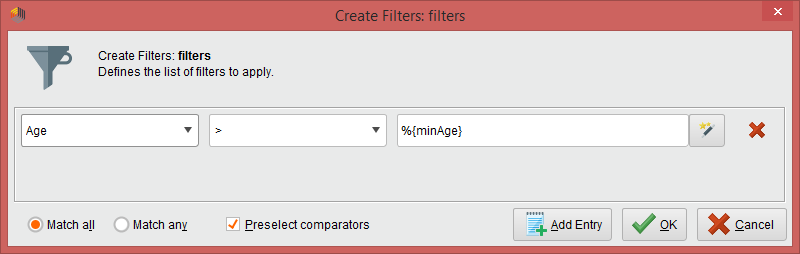
User Input elements
We would like to create a new user input component.
This component will use the variable minAge and will filter the table for passengers older then this value.
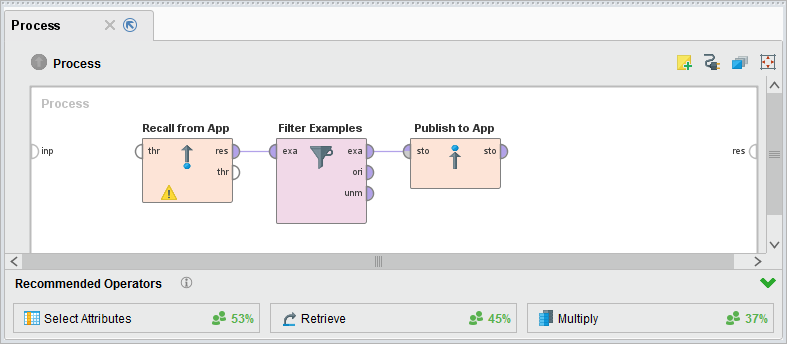
To do this we need to create a filter process first.
The process is called Update Table and has a macro called minAge.
This macro can be initialized to any value.
The process itself will Recall the Main::TableData object from the app,
filter the customer and republish it.
To have a drop down menu in Studio you can run the !Initialize process locally.
After this being done we can move over to the web interface again.
We simply need to create a new component – New user input.
Click on the Edit button, like you did before for buttons and visualizations,
to configure the behavior.
We can add one or, if we have, more variables which can be changed with this panel.
Afterwards we can add effects which happen if the user click on submit,
or in case of Submit on any change if he changes the value.
The interaction will be a Run process and will run our Update Table process.
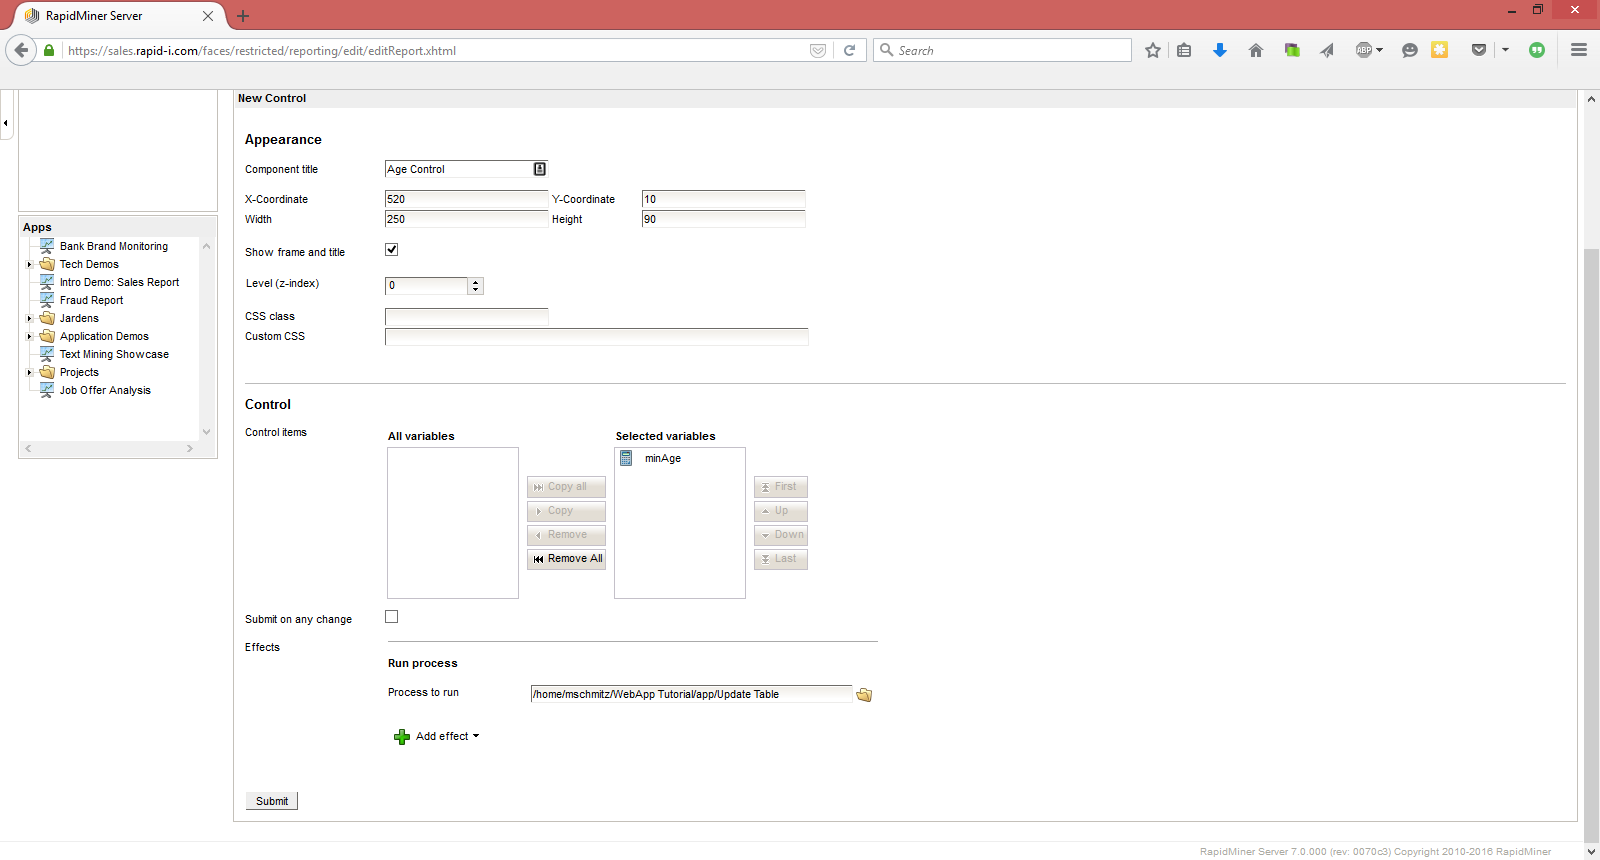
Keep in mind that server variables are mapped to process macros of the same name.
Thus, we are able to access the variable as macro with the name minAge.
That's it for the user input component.
The table will be updated, because the subscribed app object.
The charts are not updated. See the note below for details.
The current setup has a few flaws. First our charts are not updated with the user input component. Another problem is, that the filter is always applied on the currently shown data set. If you first filter for 200, you will get an empty table. If you afterwards set the filter to 20 you will get no results.
The functional approach
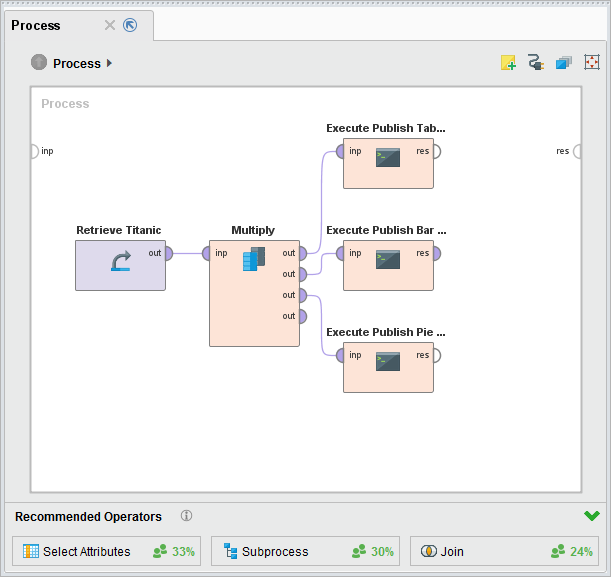
As you might know, you can use execute process operators like functions with data inputs and variable inputs (macros).
Our project can be redesigned in a way, that our visualization processes get a table as an input and prepare the table for visualization.
In our !Initialize process we would load the full date and pass it to all visualization processes.
In the update process we would again do it very similar, but only pass a filtered example set.
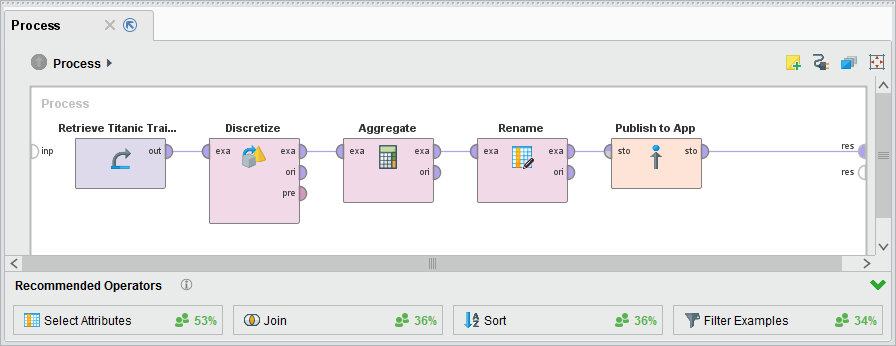
To do this we need to change all our four existing processes. All of them should not retrieve the dataset by their own, but get it as an input as depicted below for Publish Line Chart:
The !Initialize process can now push the data into those processes:
After doing that we can easily change the Update Table process and make it update all components on our Web App.
This setup will now update all our charts.
If your Web App includes a lot of filtering you might need to get the data again and again from the data base.
If you have a medium sized data set you can use an app object to have the full data in memory and only work on this.
The !Initialize process will publish a table like ::FullData and all other processes work on this.
The concrete setup depends on your data.
Interactions in graphs
As a next step we would like to introduce interaction in graphs.
To be specific we will add a second filter on the Pie Chart.
If the user clicks on the yes part, he will see only surviving passengers and vice versa.
To do this we need to create a new domain called free text with preset all.
This domain is a text with preset All.
Please create a variable in this domain called survivalFilter.
Having this setup, we need to add the filter in our created Filter Table process.
First we need to introduce a new macro into that process – survivalFilter.
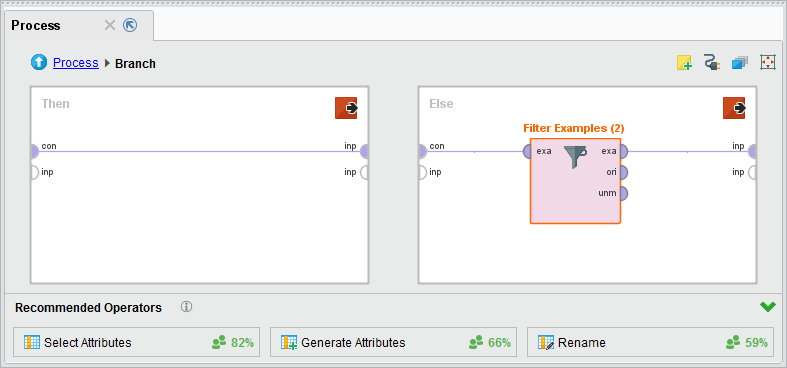
Afterwards we need a Branch operator. The Filter should only happen if we did select something.
So we choose as condition type for the branch an expression and use %{survivalFilter}=="All" as expression.
If we have selected All, we want to do nothing.
If we set something we would like to filter for it.
This results in this setup
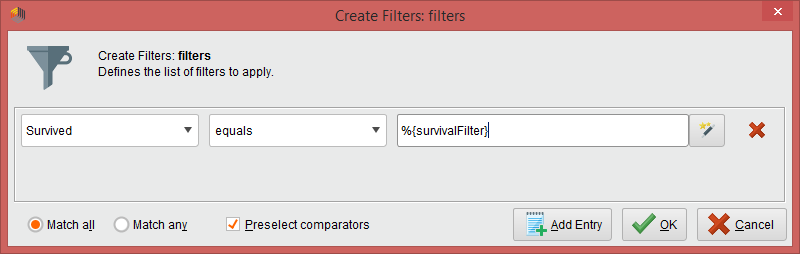
Having implemented (and saved) this, we need to add the interaction to the visualization.
Edit the pie chart and move to the interaction tab.
If you click on the pie chart in the preview, you see which values would be set to which variable.
In our case we would like to use the clicked attribute and set our variable to it.
After doing so we need to add a new effect.
This is again a Run Process and it runs the Update Table process.
That's it for the interaction. Now we get a fully interactive app.
Tabs and Views
We have now a pretty full screen – but we might want to add even more visualizations. One way is to create a bigger canvas. The size of the canvas can be defined in the General Information tab. A bigger screen is not always helpful. On RM Server Web-Apps we can also add Tabs for the users.
Tabs are based on views.
A view is simply a new canvas for our app.
We currently have only one view – called new view.
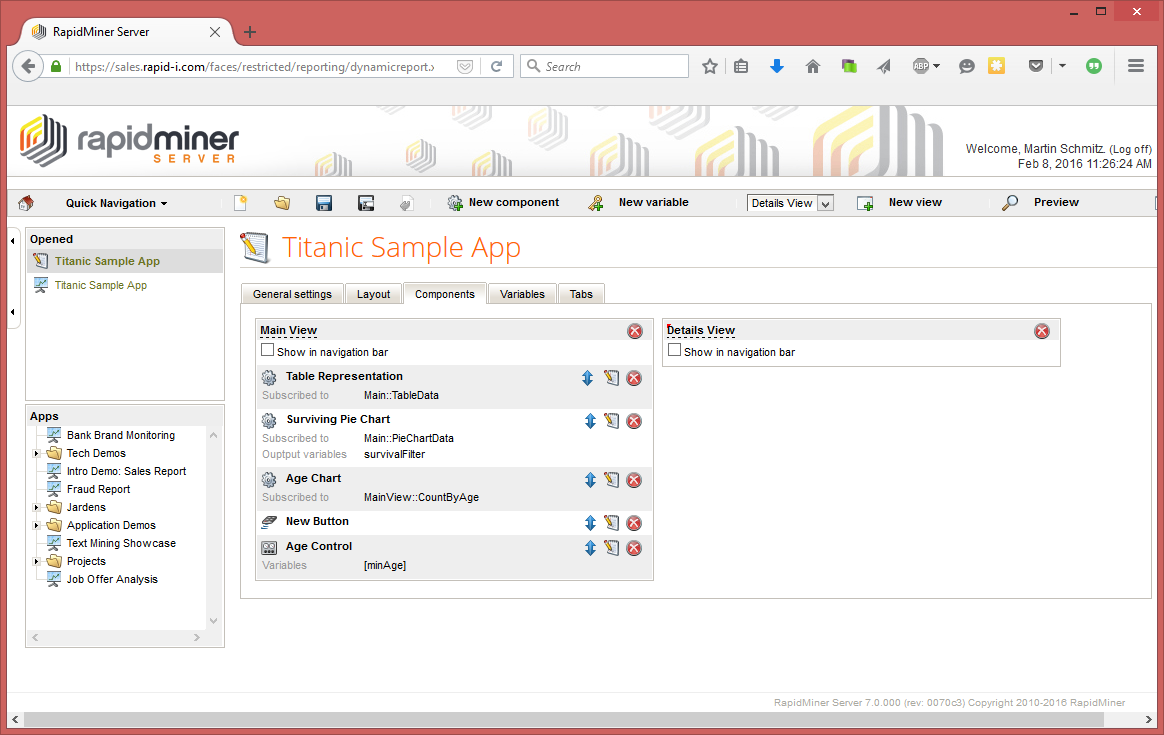
If we go to the Components tab, we can rename this by clicking on the name.
Lets rename it to Main View.
We can add another view by clicking on New View in the upper panel.
Add a new view and rename it to Details View.
You can now change the between the views using the drop down upper panel. There are two ways to make the views accessible for the user. One is using an interaction on a button, user input panel or visualization. You can simply add an interaction to switch the view. A typical example for this could be a delete button which needs confirmation.
The other way to make views accessible is the option of using tabs.
If you go to the Tabs tab in the Web App, you can create new tabs.
Switching a tab is usually but not necessarily assigned to switch to another view.
You can also trigger some processes which change only the content of the current view.
In our case we create two tabs by clicking on the left add effect,
which are the views we just created.
Create a new tab named Main and add an effect change view to the Main view.
Add another tab called Details and add the fitting effect.
If we save the app and go to preview we see the tabs in the upper part of the Web App.
If you have a big web-app you might get into the problem,
that your !Initialize process takes more than a few seconds.
This is usually to much for a user.
To reduce this problem you can split the !Initialize process and only execute the !Initialize process for the main view at start up.
You can then create !Initialize processes for each tab which can be executed before changing the tab.
Conclusion
We have now built a basic Web App together. You know the fundamentals of Web App creation and can combine them with all the functionality you can imagine in a RapidMiner Process. Of course there are further options which will be included in and advanced tutorial, like selection trees, CSS, integration of various APIs, use of documents in app objects etc. But all of those things are based you learned in this tutorial and are straight forward.