You are viewing the RapidMiner Radoop documentation for version 9.4 - Check here for latest version
Logging and Monitoring
Much useful information about RapidMiner Radoop processes can be found in the logs on your client machine and on the cluster. Most of them can be accessed via a web interface. This section describes the location of the most important logs and helps you access your cluster's web interfaces.
Both RapidMiner Studio and RapidMiner Server create log files, which, among other information, preserve errors for easier diagnosis. Often, RapidMiner Support will request these files to help with troubleshooting. The Extract Logs option is an easy way to collect and share your logs for troubleshooting.
The Extract Logs action
The ![]() Extract Logs action on the Manage Radoop Connections window. Extract Logs will collect all details about your connection test results and package them into a zip file. Passwords and other sensitive details are removed from the connection entries and the logs before packaging them up. This zip file can be later submitted to support for troubleshooting.
Extract Logs action on the Manage Radoop Connections window. Extract Logs will collect all details about your connection test results and package them into a zip file. Passwords and other sensitive details are removed from the connection entries and the logs before packaging them up. This zip file can be later submitted to support for troubleshooting.
List of the collected log files:
connection_entry.xml: Your currently displayed Radoop connection entry. The Hive and Kerberos passwords are not included.connection_test_log4j.log: The log4j logs of the Hadoop communication during the last Connection Test.connection_test_logpanel.log: The content of the Connection Test log panel.hadoop_properties.log: Output of theset -vcall on your cluster. The Hive and Kerberos passwords are not included.rapidminer-studio.log: RapidMiner Studio’s log file that is stored by default in the .RapidMiner folder of the user.rm_preferences.cfg: The Preference settings of RapidMiner Studio.rm_version.cfg: The installed extensions and their versions in RapidMiner Studio.studio_log_panel.log: The content of the RapidMiner Studio Log Panel on FINEST level.test_setup.cfg: The enabled integration tests and their timeouts.<TESTNAME>_<applicationId>.log: Logs of the applications that were executed during the integration test. If an application log can’t be collected for any reason, it is skipped.
Where to find log files
Sometimes it is required to check the separate log files for troubleshooting. The most important client and cluster side logs are presented in this section.
RapidMiner Studio Log Files
RapidMiner Studio saves logs in the .RapidMiner subdirectory of your user home directory. There, you can find the main log file, rapidminer-studio.log. If you have problems starting RapidMiner, check launcher.log for additional information about the startup process.
RapidMiner Server Log Files
RapidMiner Server saves logs in <Install Directory>\standalone\log. By default, each day the server logs all activity and change files. These files can become quite large if the server is used heavily. If you are sending a log file to Support, it is best not to send the entire file. Instead, select and send only the relevant parts, for example using the time stamp at the beginning of every row to identify the rows to send.
RapidMiner Studio Log Panel
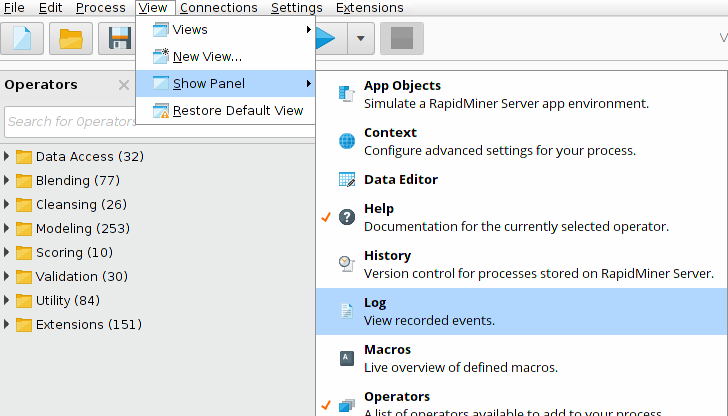
RapidMiner Radoop logs many useful information - including the generated Hive queries - in the Log panel. By default this panel is hidden in RapidMiner Studio but it is highly recommended to open it when using RapidMiner Radoop. You can open the Log panel by selecting View > Show Panel > Log in the RapidMiner Studio menu.
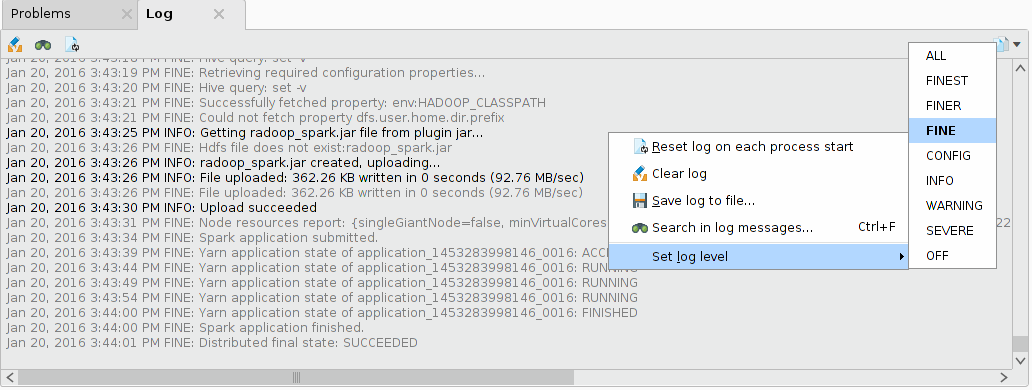
To see Radoop’s Hive queries you need to set the logging level to FINE. You can do so by right-clicking in the Log panel and selecting Set log level > FINE.
If you have troubleshooting questions about a Radoop process please include the Log panel content in your question on the RapidMiner Support portal.
Enable log4j logging for RapidMiner
Hadoop libraries log detailed information using log4j, which may help resolving communication and connection setup issues. Please note that the log4j logs contain information only for Hadoop communication, excluding Hive communication.
The log4j logging can be enabled on the Settings/Preferences menu item. Navigate to the Radoop page and set the Enable Log4j logging property to true. By default the log file is created in the RapidMiner user directory called radoop_log4j.log. If you want to override the default logging settings, set the Log4j properties file property to a valid log4j.properties file.
Application Logs
Every MapReduce and Spark job creates logs while running. If your cluster is configured to preserve the log files, they are accessible after a job is finished. Set the yarn.nodemanager.delete.debug-delay-sec property on the cluster to a high number (e.g. 10000) to keep the logs of a finished job.
The Application Master logs can be found on the YARN Resource Manager interface by selecting the Cluster > Applications menu. You can identify the job you are looking for by checking the Name of the application (it is the name of the corresponding Radoop operator) and the FinalStatus (look for the FAILED status if your process didn’t finish successfully). If you found the application you are looking for, click on the ID (something like application_1430386217152_0015) and open the logs link.
RapidMiner Radoop offers aggregated log collection for some operators, like Read CSV and Spark Script. This is particularly useful for investigating failed MapReduce or Spark jobs. The aggregated log collection needs that the yarn.log-aggregation-enable=true, yarn.nodemanager.remote-app-log-dir and the yarn.nodemanager.remote-app-log-dir-suffix are set on the cluster. Please note that for Impala connections the last two properties must be provided manually as Advanced Hadoop Settings. The timeout for this feature can be adjusted on the Preferences page.
Hive Logs
The cause of some issues can be identified by opening the Hive Server log. You may be able to access this log through your cluster management interface, e.g. Cloudera Manager. However, the log can not always be accessed remotely. You may need to SSH into the cluster and search for the Hive log files. The location and the name of the Hive logs may differ for every distribution and Hive version. On CDH5 it is /var/log/hive/hive-server2.log by default. Also note that Hive may start so-called local Hive tasks to accomplish simple local jobs. These tasks may run on any nodes, and their log files may reside in the local /tmp/ or /tmp/hive/ directories, by default, on the file system of the particular nodes. Details of certain errors (MapredLocalTask errors) may only be available in these task specific log files.
The Hive query logs are collected and displayed in the RapidMiner Studio log panel in case of an error. This feature requires Hive version 0.14 or newer. To be able to retrieve the Hive logs, the hive.server2.logging.operation.enabled=true property must be set on the cluster - this is the default behaviour for CDH and HDP clusters.
The logging level can be changed with the hive.server2.logging.operation.level=VERBOSE property. It can be set on the Connection Settings dialog as an Advanced Hive Parameter. Please note that this works only on Hive 1.2 or newer.
Resource Manager and Node Manager Logs
If you want to access the Resource Manager or Node Manager logs you need to navigate to Tools > Local logs on the Resource Manager monitoring page. Look for logs with names like yarn-yarn-nodemanager-[domain-name].log and yarn-yarn-resourcemanager-[domain-name].log.
RapidMiner Radoop uses the powerful Hadoop Data view, an easy-to-use graphical tool, for:
- managing, importing, and querying Hive and Impala database objects
- examining arbitrary data samples
- developing Hive and Impala scripts that can be integrated into RapidMiner Radoop processes.
You can monitor the NameNode and the ResourceManager of your Hadoop cluster using a web browser.
NameNode Monitoring
The NameNode monitoring page contains information on the cluster’s status, health, and version, as well as provides access to the logs and to the HDFS filesystem. By default, it can be accessed at the following URL:
http://<namenode_address>:50070
ResourceManager Monitoring
ResourceManager is the service within Hadoop that arbitrates resources among all the applications in the system. The ResourceManager administration page provides detailed information on the applications and jobs running in the cluster. From the page you can view logs and information about the MapReduce jobs executing the tasks of a RapidMiner Radoop process. By default, the administration page can be accessed at the following URL:
http://<resource_manager_address>:8088
Monitoring Spark applications on the Spark UI
Spark Applications can be tracked on the Spark web UI. It automatically starts by default on port 4040 (or 4041, 4042, etc.). The Spark UI is useful for example to check the progress of a running Spark operator or to check to the Spark master and executor logs. To navigate to the Spark UI, open the Resource Manager interface and select the link to the running Spark job’s Application Master. The URL should look like the following:
http://<resource_manager_address>:8088/proxy/<application_id>