You are viewing the RapidMiner Hub documentation for version 9.8 - Check here for latest version
Create a dashboard
This document describes how to create a dashboard using data from your RapidMiner processes, assuming you have deployed RapidMiner AI Hub via Docker, Kubernetes, or in the cloud.
Log in and manage users
The Dashboards tool is accessible via the RapidMiner AI Hub
landing page,
or by navigating to http(s)://your-platform-deployment/grafana/.
Your authorized set of functions in Dashboards will depend on the role you have configured for your user. By default, all users are allowed to create and edit dashboards. For more information on the exact role mappings, and configuring roles, go to the relevant page of Manage deployments.
Dashboards and panels
Dashboards are built up from panels. Each panel defines:
- One or multiple queries to be executed on the selected Data Source.
- The visualization type (e.g. pie chart, table, heatmap, ...) and its configuration (e.g. coloring, axes configuration and any visualization-specific setting)
- Some general settings, like the panel title.
The different visualization types can be used on different data sets. For example, timeseries data can be plotted using some of the line-chart plugins or heatmaps. Pie charts or bar charts are better for displaying table data.
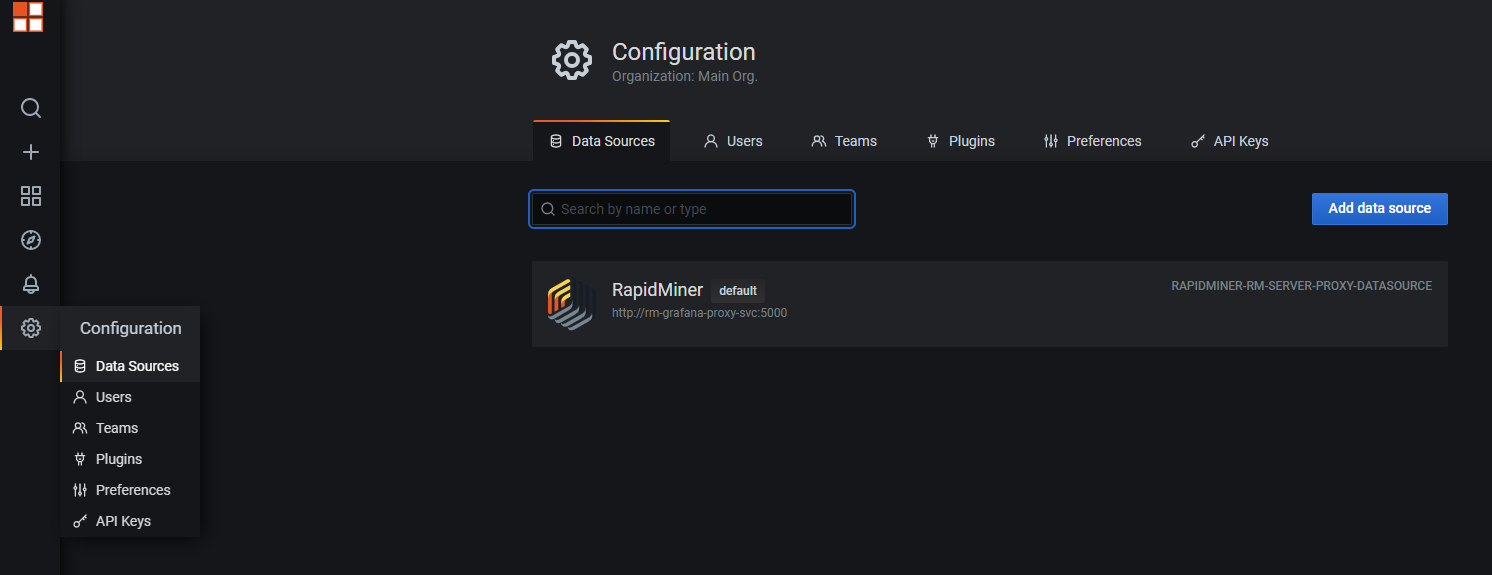
Data sources
Select Configuration > Data Sources, and configure the data source as follows:
- Select type: RapidMiner
- Set the URL to the proxy endpoint, by default port 5000.
- Select Basic Auth and provide your RapidMIner AI Hub login credentials.
To expose your data, take the following steps:
Create and save in your repository a process whose output is a data set compatible with the panel you want to build: a time series, a table for a scatter plot, etc.
Create a web service based on that process. The output format MUST be JSON.
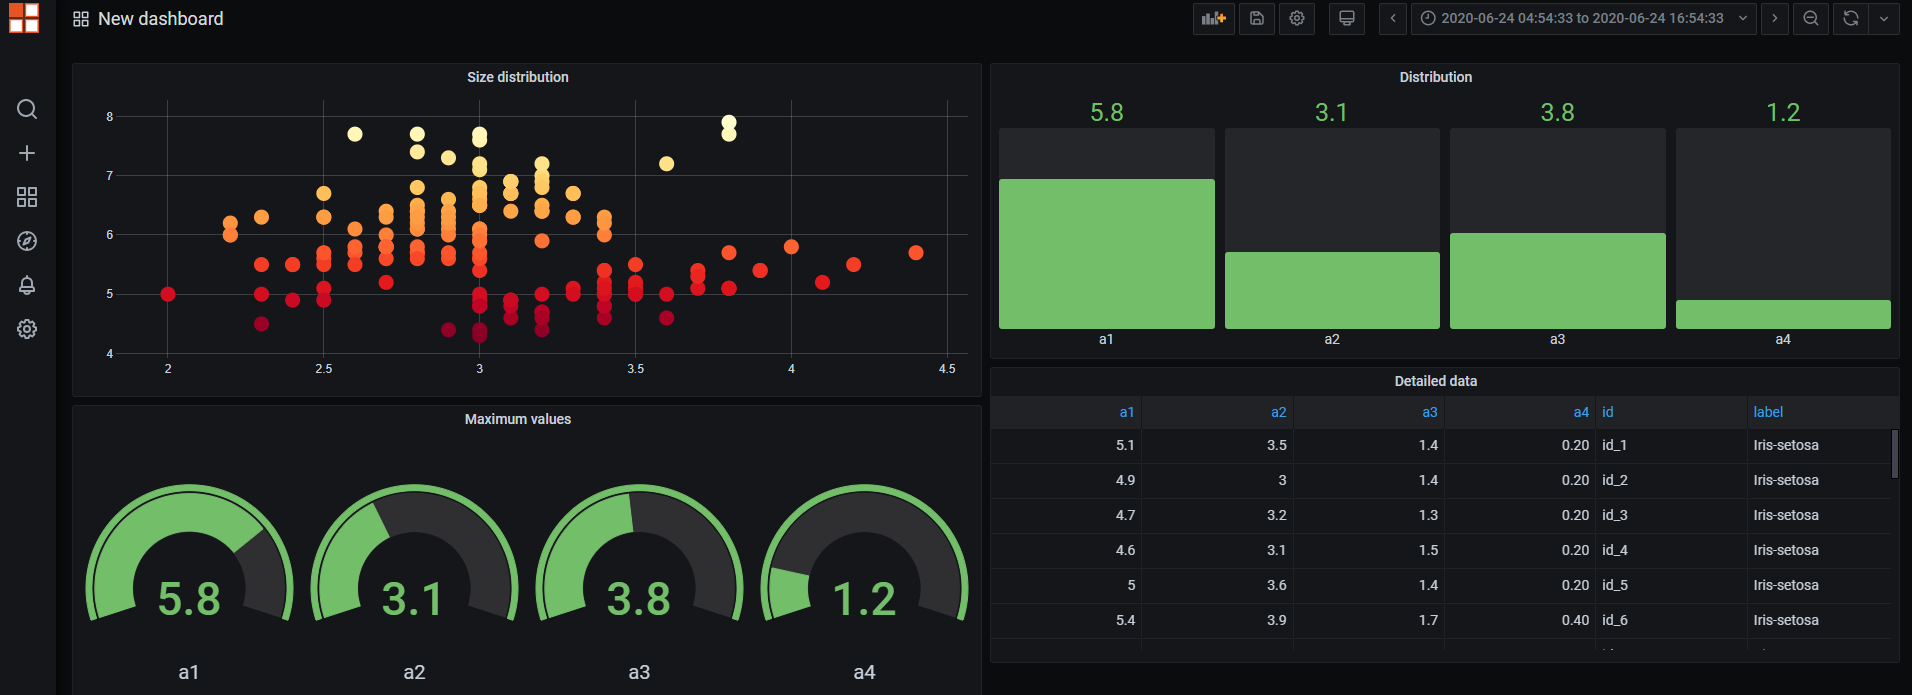
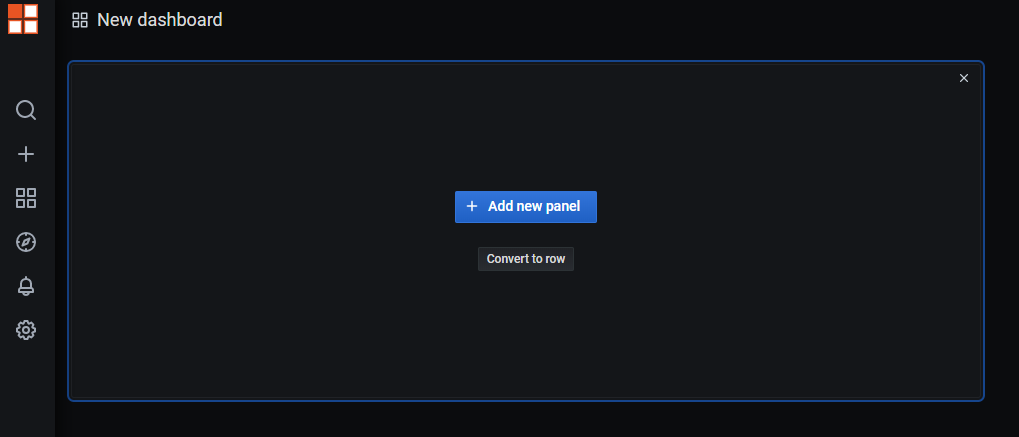
Create your dashboard
You start by creating an empty dashboard and adding new panels to it.
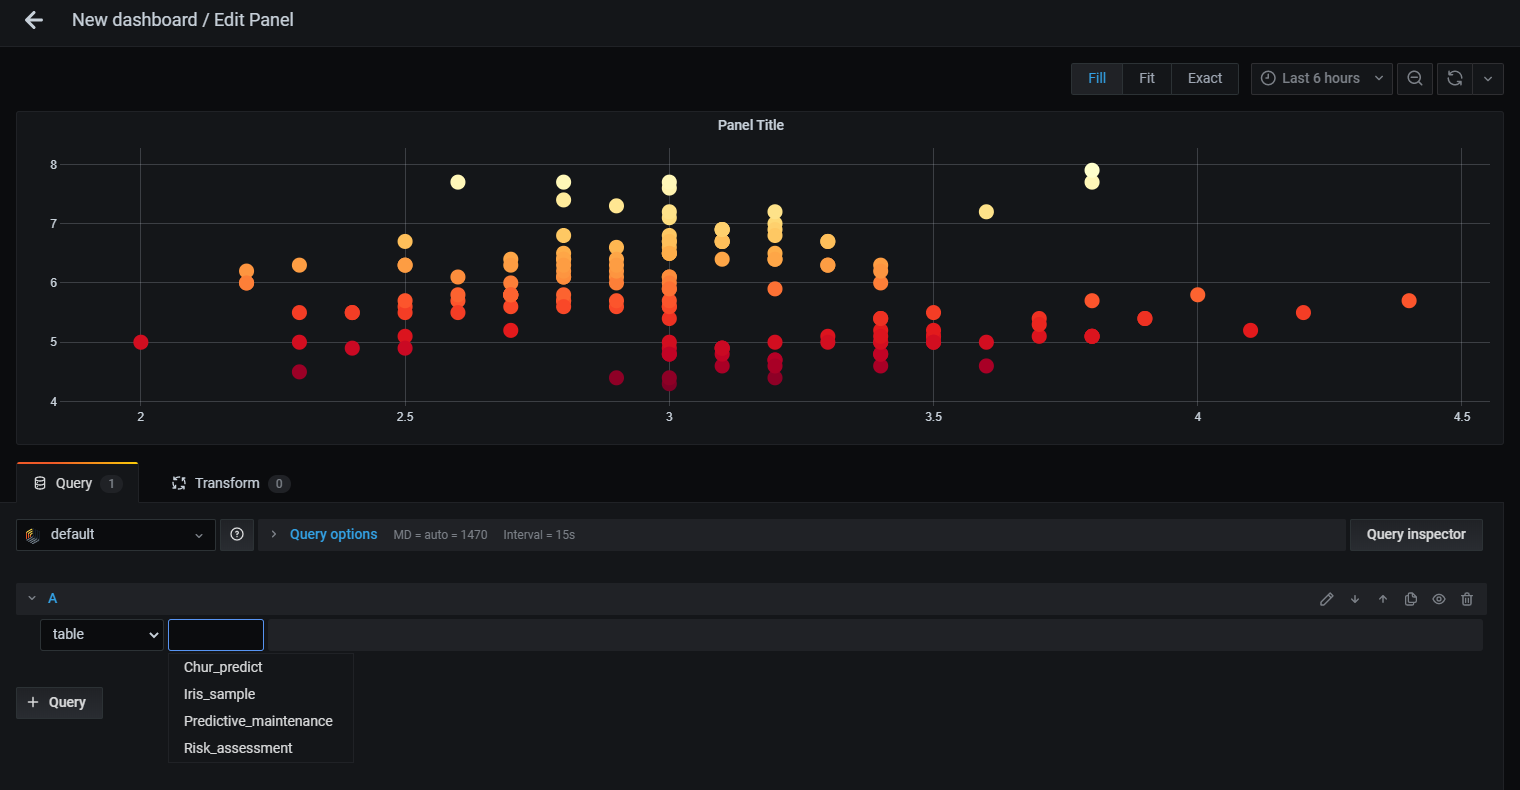
Then you have to add a query, selecting
- the data source (RapidMiner),
- the type (timeseries or table), and
- the metric, which is the web service that you created.
A dropdown list is displayed, with the web services you have created on RapidMiner AI Hub.
You can see a preview of the panel as you configure it. Once you're done, add it to your dashboard. You can add as many panels to the dashboard as you need. Resizing panels and moving them around can be done graphically by simple point and click.
In general, the key to getting the right visualization is to observe the following points:
- Make sure the output of the RapidMiner process has the right format
- Make sure the panel is configured with the right query
- Configure the visualization in the way you desire
Plugins
The docker image we ship includes some useful visualization plugins, but you can install additional plugins.
To install a new plugin, execute the plugin install command inside the container, and then restart it:
user@host:~$ docker-compose exec rm-grafana-svc bash
grafana@grafana-container:/usr/share/grafana$ grafana-cli plugins install --plugin-name--
user@host:~$ docker-compose restart rm-grafana-svc
Details
RapidMiner Data Source supports two types of data sets as response:
- Timeseries data: when your data set contains a
timestampattribute (important: the attribute name should betimestamp) and multiple attributes as values. - Table data: when your data set does not contain a
timestamp, but rather, a table with numerical values compatible with the visualization you intend to create.