Monitoring
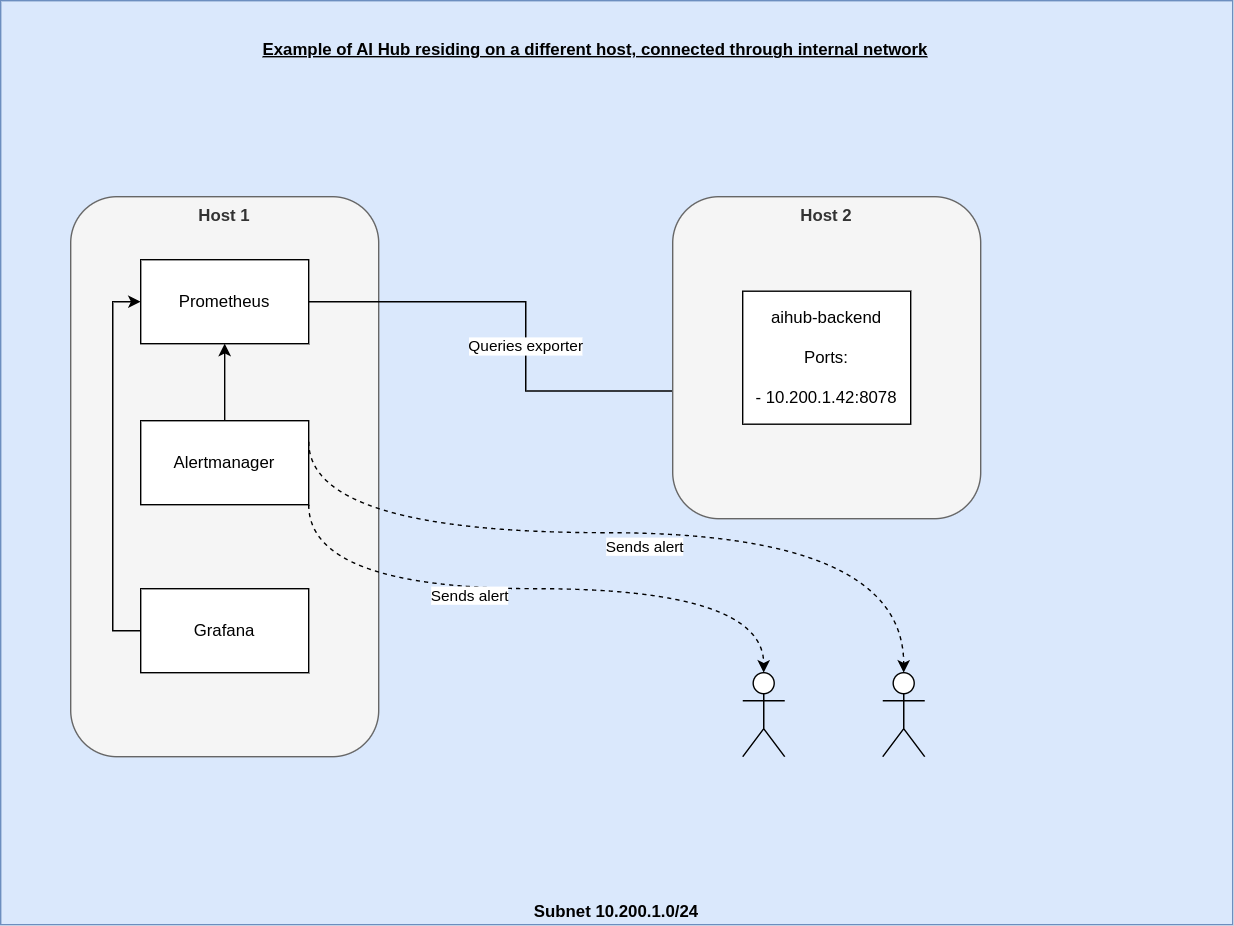
AI Hub components offer Prometheus exporters. Prometheus is an open-source monitoring and alerting system that collects metrics from various sources, stores them, and provides a flexible query language to analyze the data. This document outlines which data is available and how a Prometheus, Alertmanager, which handles alerts sent by client applications such as the Prometheus server, and Grafana, a visualization tool that works seamlessly with Prometheus to create beautiful and customizable dashboards, setup might look like. The suggested set up would install a Prometheus instance for the collection of metrics, Grafana for rendering the metrics as charts and Alertmanager for providing Alert functionality. If Alertmanager should not be used, Grafana also has alerting functionality.
Download
An example how to set up a docker stack with Prometheus and Grafana can be found in the awesome-compose repository and an example for Alertmanager can be found in the official docker repository
The dashboards for the different AI Hub components can be downloaded from here:
- General JVM metrics (all components)
- AI Hub Server
- Job Agent
- Web API Agent
- Web API Gateway
- AI Hub License Proxy
Usage
To use Prometheus exporters, the application needs to add prometheus to the SPRING_PROFILES_ACTIVE environment variable. For example,
this variable would look like SPRING_PROFILES_ACTIVE=default,webapi, prometheus for a Web API Agent.
Metrics are exported on the management port and listen address. All applications can use the following properties.
Spring binds the management port to the address defined in the environment variable MANAGEMENT_SERVER_ADDRESS which defaults to 0.0.0.0
and MANAGEMENT_SERVER_PORT=8077. These environment variables should not be changed. Changes to the exposed port should be handled in the deployment descriptor file
of the respective deployment.
When the profile is set and the management port is exposed, the monitoring stack can sample the metrics exposed from it:
A reference for the ports currently configured for each application is below.
| Application | Port |
|---|---|
| Job Agent | 8066 |
| Scoring Agent | 8067 |
| Server | 8077 |
| Web API Agent | 8067 |
| Web API Gateway | 8078 |
| License Proxy | 9191 |
If you deploy multiple instances of any application, ensure to switch the default port mapping to an available port if residing on the same host.
Server: What is available?
Besides default JVM metrics, the following custom metrics are available. Here's an example how the data might look like:
com_rapidminer_aihub_metrics_free_space 8.3113455616E10
com_rapidminer_aihub_schedules{state="PAUSED",} 0.0
com_rapidminer_aihub_schedules{state="ACTIVE",} 0.0
com_rapidminer_rest_forbidden_total 0.0
com_rapidminer_aihub_repositories_disk_space{archive="false",lfs="false",name="sample-test",} 144929.0
com_rapidminer_aihub_repositories_disk_space{archive="false",lfs="false",name="sample-dev",} 928693.0
com_rapidminer_aihub_repositories_disk_space{archive="false",lfs="false",name="sample-production",} 163799.0
com_rapidminer_aihub_metrics_operators 368.0
com_rapidminer_aihub_jobs_running{queue="DEFAULT",} 0.0
com_rapidminer_aihub_metrics_max_memory 8.355053568E9
com_rapidminer_rest_not_found_total 0.0
com_rapidminer_rest_unauthorized_total 0.0
com_rapidminer_rest_conflict_total 0.0
com_rapidminer_aihub_jobs_pending{queue="DEFAULT",} 0.0
com_rapidminer_rest_bad_request_total 0.0
com_rapidminer_rest_unprocessable_total 0.0
com_rapidminer_aihub_metrics_extensions 0.0
com_rapidminer_aihub_metrics_used_memory 3.76600808E8
com_rapidminer_rest_illegal_argument_total 0.0
com_rapidminer_aihub_metrics_total_space 2.4858109952E11
com_rapidminer_aihub_metrics_total_allocated_memory 1.191182336E9
com_rapidminer_rest_internal_total 1.0
com_rapidminer_rest_service_unavailable_total 0.0

com_rapidminer_aihub_endpoints_error{deploymentPath="test",groupName="DEFAULT",} 1.0
com_rapidminer_aihub_endpoints_error{deploymentPath="abc",groupName="DEFAULT",} 0.0
com_rapidminer_aihub_endpoints_deployed{deploymentPath="test",groupName="DEFAULT",} 0.0
com_rapidminer_aihub_endpoints_deployed{deploymentPath="abc",groupName="DEFAULT",} 0.0
com_rapidminer_aihub_endpoints_warning{deploymentPath="test",groupName="DEFAULT",} 0.0
com_rapidminer_aihub_endpoints_warning{deploymentPath="abc",groupName="DEFAULT",} 1.0
com_rapidminer_aihub_endpoints_created{deploymentPath="test",groupName="DEFAULT",} 0.0
com_rapidminer_aihub_endpoints_created{deploymentPath="abc",groupName="DEFAULT",} 0.0

com_rapidminer_aihub_webapi_groups_agents_starting{groupName="DEFAULT",id="99827da3-dbb6-45ee-9ddf-5923e2b7eee2",} 0.0
com_rapidminer_aihub_webapi_groups_agents_down{groupName="DEFAULT",id="99827da3-dbb6-45ee-9ddf-5923e2b7eee2",} 0.0
com_rapidminer_aihub_webapi_groups_agents_unknown{groupName="DEFAULT",id="99827da3-dbb6-45ee-9ddf-5923e2b7eee2",} 0.0
com_rapidminer_aihub_webapi_groups_agents_up{groupName="DEFAULT",id="99827da3-dbb6-45ee-9ddf-5923e2b7eee2",} 0.0
com_rapidminer_aihub_webapi_groups_agents_outofservice{groupName="DEFAULT",id="99827da3-dbb6-45ee-9ddf-5923e2b7eee2",} 1.0
Job Agent: What is available?
Besides default JVM metrics, the following custom metrics are available. Here's an example how the data might look like:
com_rapidminer_jobagent_containers_errors_jobs{containerName="1",id="4a89b526-8795-4f28-aa59-7eaa8c27a0c2",name="devagent",queue="DEFAULT",} 0.0
com_rapidminer_jobagent_containers_processed_jobs{containerName="1",id="4a89b526-8795-4f28-aa59-7eaa8c27a0c2",name="devagent",queue="DEFAULT",} 0.0

com_rapidminer_jobagent_containers_max_memory{id="4a89b526-8795-4f28-aa59-7eaa8c27a0c2",name="devagent",queue="DEFAULT",} 2048.0
com_rapidminer_jobagent_containers_expected{id="4a89b526-8795-4f28-aa59-7eaa8c27a0c2",name="devagent",queue="DEFAULT",} 1.0

com_rapidminer_jobagent_containers_starting{id="4a89b526-8795-4f28-aa59-7eaa8c27a0c2",name="devagent",queue="DEFAULT",} 0.0
com_rapidminer_jobagent_containers_free_available{id="4a89b526-8795-4f28-aa59-7eaa8c27a0c2",name="devagent",queue="DEFAULT",} 1.0
com_rapidminer_jobagent_containers_unreachable{id="4a89b526-8795-4f28-aa59-7eaa8c27a0c2",name="devagent",queue="DEFAULT",} 0.0
com_rapidminer_jobagent_containers_running{id="4a89b526-8795-4f28-aa59-7eaa8c27a0c2",name="devagent",queue="DEFAULT",} 1.0

com_rapidminer_jobagent_shutdown_invoked{id="4a89b526-8795-4f28-aa59-7eaa8c27a0c2",name="devagent",queue="DEFAULT",} 0.0
com_rapidminer_jobagent_maintenance_enabled{id="4a89b526-8795-4f28-aa59-7eaa8c27a0c2",name="devagent",queue="DEFAULT",} 0.0
com_rapidminer_jobagent_events_unsent{id="4a89b526-8795-4f28-aa59-7eaa8c27a0c2",name="devagent",queue="DEFAULT",} 0.0
com_rapidminer_jobagent_events_sent{id="4a89b526-8795-4f28-aa59-7eaa8c27a0c2",name="devagent",queue="DEFAULT",} 0.0

com_rapidminer_jobagent_containers_memory_free{containerName="1", id="4a89b526-8795-4f28-aa59-7eaa8c27a0c2", instance="jobagent1", job="jobagents", name="devagent"queue="DEFAULT",}
com_rapidminer_jobagent_containers_memory_allocated{containerName="1", id="4a89b526-8795-4f28-aa59-7eaa8c27a0c2", instance="jobagent1", job="jobagents", name="devagent"queue="DEFAULT",}
com_rapidminer_jobagent_containers_memory_max{containerName="1", id="4a89b526-8795-4f28-aa59-7eaa8c27a0c2", instance="jobagent1", job="jobagents", name="devagent"queue="DEFAULT",}
Web API Gateway: What is available?
Besides default JVM metrics, the following custom metrics are available. Here's an example how the data might look like:
loadbalancer_requests_active{serviceId="DEFAULT",serviceInstance_host="127.0.0.1",serviceInstance_instanceId="hostname:DEFAULT:8090",serviceInstance_port="8090",} 0.0

loadbalancer_requests_success_seconds_count{method="POST",outcome="SUCCESS",serviceId="DEFAULT",serviceInstance_host="127.0.0.1",serviceInstance_instanceId="hostname:DEFAULT:8090",serviceInstance_port="8090",status="200",uri="/api/v1/services/deploypath/normalize_iris",} 3.0
loadbalancer_requests_success_seconds_sum{method="POST",outcome="SUCCESS",serviceId="DEFAULT",serviceInstance_host="127.0.0.1",serviceInstance_instanceId="hostname:DEFAULT:8090",serviceInstance_port="8090",status="200",uri="/api/v1/services/deploypath/normalize_iris",} 0.9355338
loadbalancer_requests_success_seconds_max{method="POST",outcome="SUCCESS",serviceId="DEFAULT",serviceInstance_host="127.0.0.1",serviceInstance_instanceId="hostname:DEFAULT:8090",serviceInstance_port="8090",status="200",uri="/api/v1/services/deploypath/normalize_iris",} 0.5108118

loadbalancer_requests_failed_seconds_count{exception="RetryableStatusCodeException",method="POST",serviceId="DEFAULT",serviceInstance_host="127.0.0.1",serviceInstance_instanceId="hostname:DEFAULT:8090",serviceInstance_port="8090",uri="/api/v1/services/deploypath/normalize_iris",} 16.0
loadbalancer_requests_failed_seconds_sum{exception="RetryableStatusCodeException",method="POST",serviceId="DEFAULT",serviceInstance_host="127.0.0.1",serviceInstance_instanceId="hostname:DEFAULT:8090",serviceInstance_port="8090",uri="/api/v1/services/deploypath/normalize_iris",} 0.1764999
loadbalancer_requests_failed_seconds_max{exception="RetryableStatusCodeException",method="POST",serviceId="DEFAULT",serviceInstance_host="127.0.0.1",serviceInstance_instanceId="hostname:DEFAULT:8090",serviceInstance_port="8090",uri="/api/v1/services/deploypath/normalize_iris",} 0.0439024
Web API Agent: What is available?
Besides default JVM metrics, the following custom metrics are available.
# Total number of executions attempted
com_rapidminer_scoring_execution_total{basePath="deploypath",endpointPath="normalize_iris",} 2.0

# Total number of executions completed successfully
com_rapidminer_scoring_execution_complete_total{basePath="deploypath",endpointPath="normalize_iris",} 2.0
Setup
After composing the Prometheus, Grafana and Alertmanager stack, the Prometheus endpoints of the AI Hub Components need to be added to the Prometheus configuration file as
scrape_configs. For further information about how to set up Prometheus, please look into the official Documentation.
For example, the configuration for the AI Hub Server could look like this:
- job_name: aihubs
  scrape_interval: 30s
  scrape_timeout: 10s
  metrics_path: /actuator/prometheus
  static_configs:
    - targets: ['${PROMETHEUS_ADDRESS}']
      labels:
        instance: 'aihub1'
Alerts could also be added to Prometheus, for example:
- name: example
  rules:
  - alert: EndpointsError
    expr: com_rapidminer_aihub_endpoints_error{groupName="DEFAULT"} > 0
    for: 10m
    labels:
      severity: high
    annotations:
      summary: Endpoints error
After the Prometheus configuration and alerts have been set up, the example dashboards can be imported into Grafana. The easiest way to get started:
- Create Prometheus connection.
- On the Grafana home page, click on the
Configurationgear icon on the left sidebar and selectData Sources. - Click on the
Add data sourcebutton. - Select
Prometheusas the data source type. - Configure the Prometheus data source with the adress of the installed prometheus instance.
- Click on the
Save & Testbutton to test the connection to Prometheus. - Import Dashboards.
- You need the example Grafana dashboard JSON files provided.
- On the Grafana home page, click on the
+icon on the left sidebar and selectImport. - Click on the
Upload .json filebutton and select the downloaded dashboard JSON file. - Configure the dashboard settings and click on the
Importbutton to import the dashboard. - You should now see the imported dashboard with metrics from AI Hub Server, Job Agent, Web API Gateway and Web API Agent.
- You can now explore metrics, create custom dashboards, and gain insights into the performance and health of these components.
For further information, you can consult the official Grafana documentation. Please consult the official Alertmanager documentation to see how this could be set up.
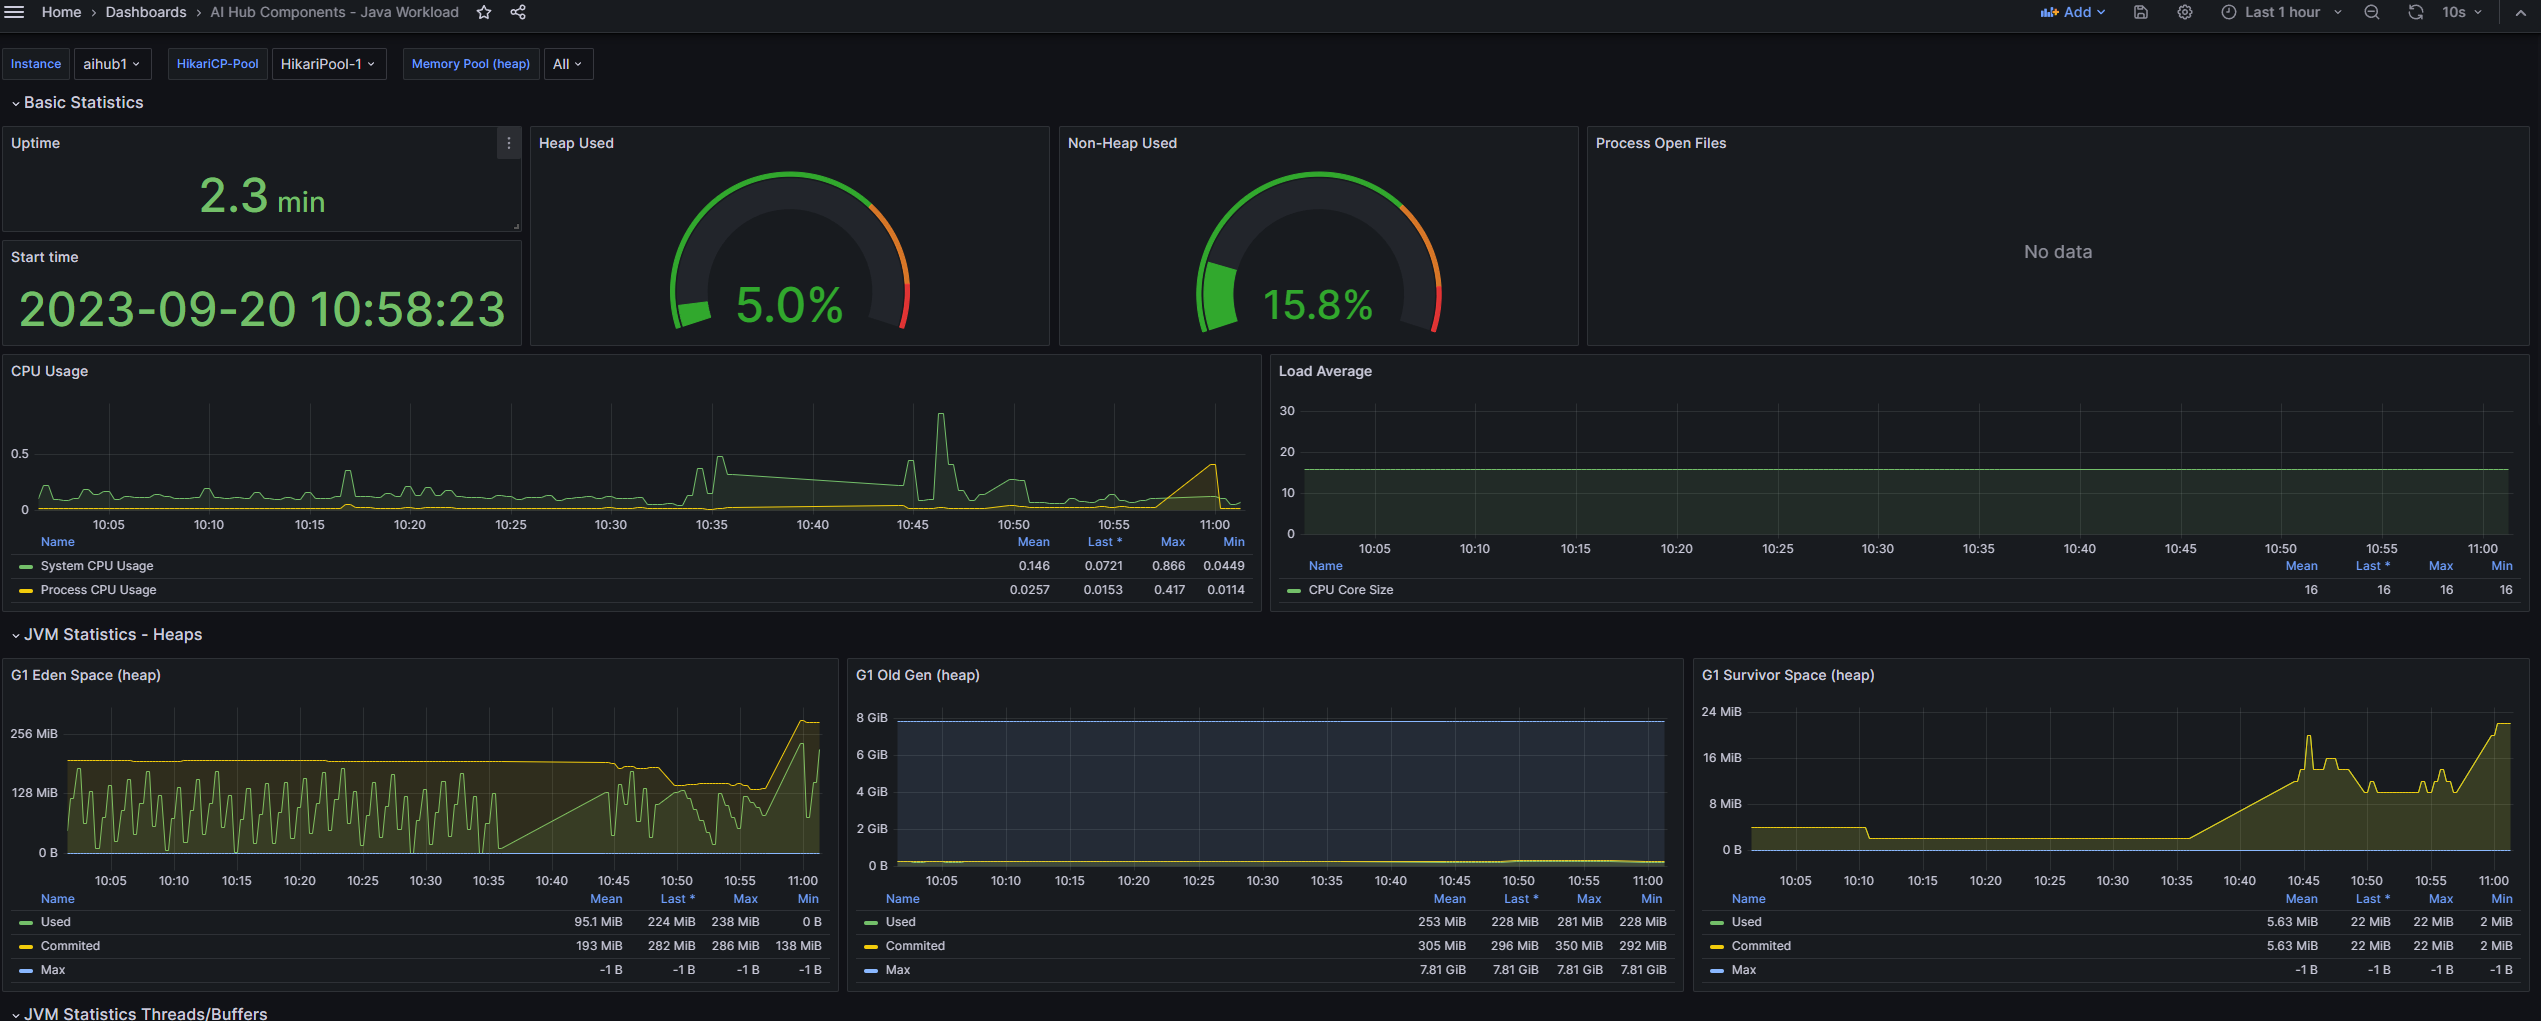
When everything is set up correctly, the dashboards could look like this: For the general Java metrics:
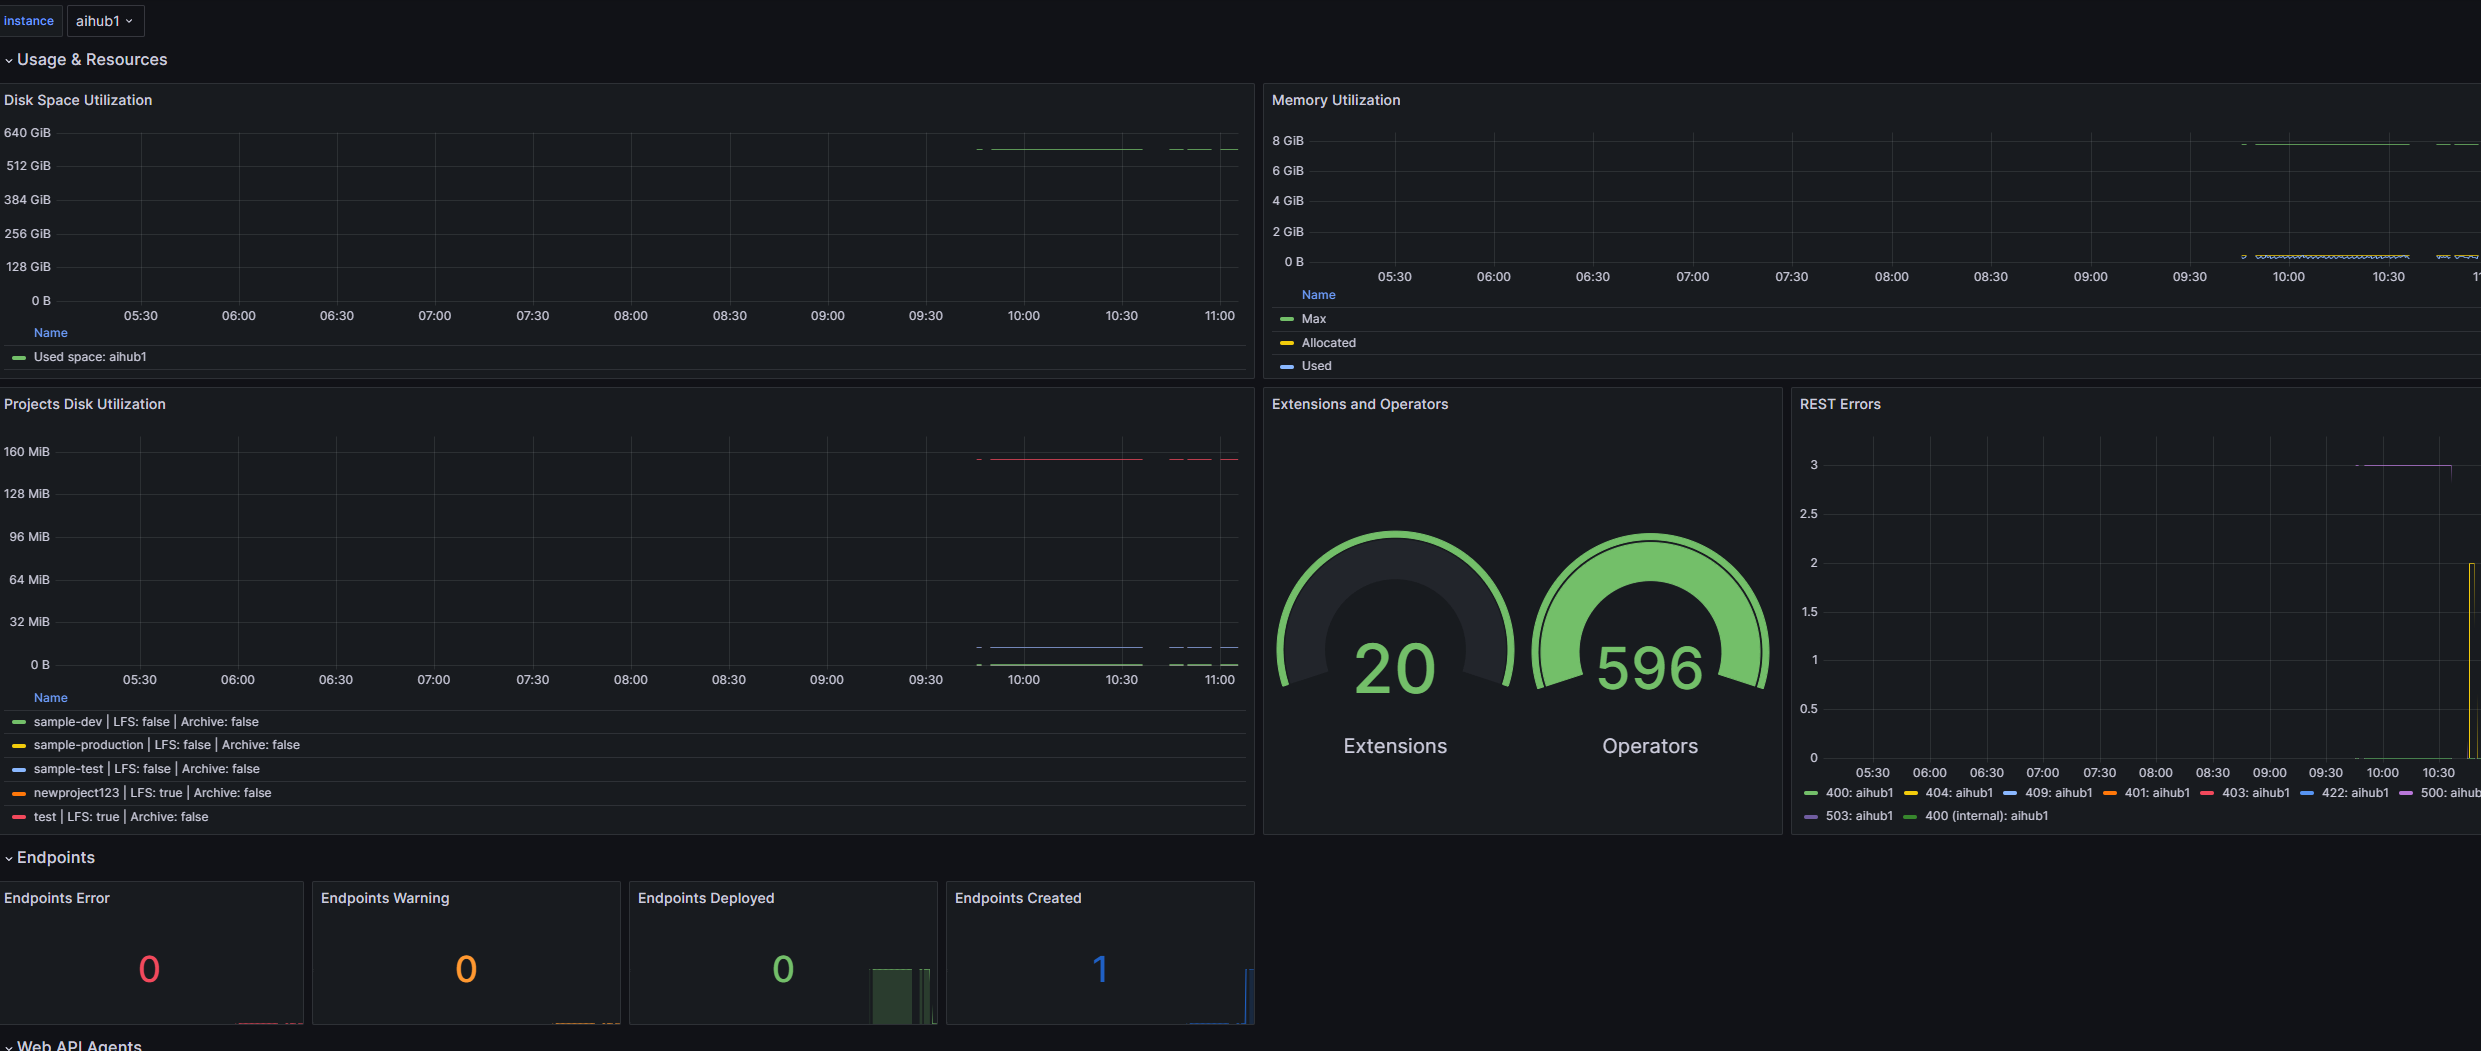
For AI Hub Server:
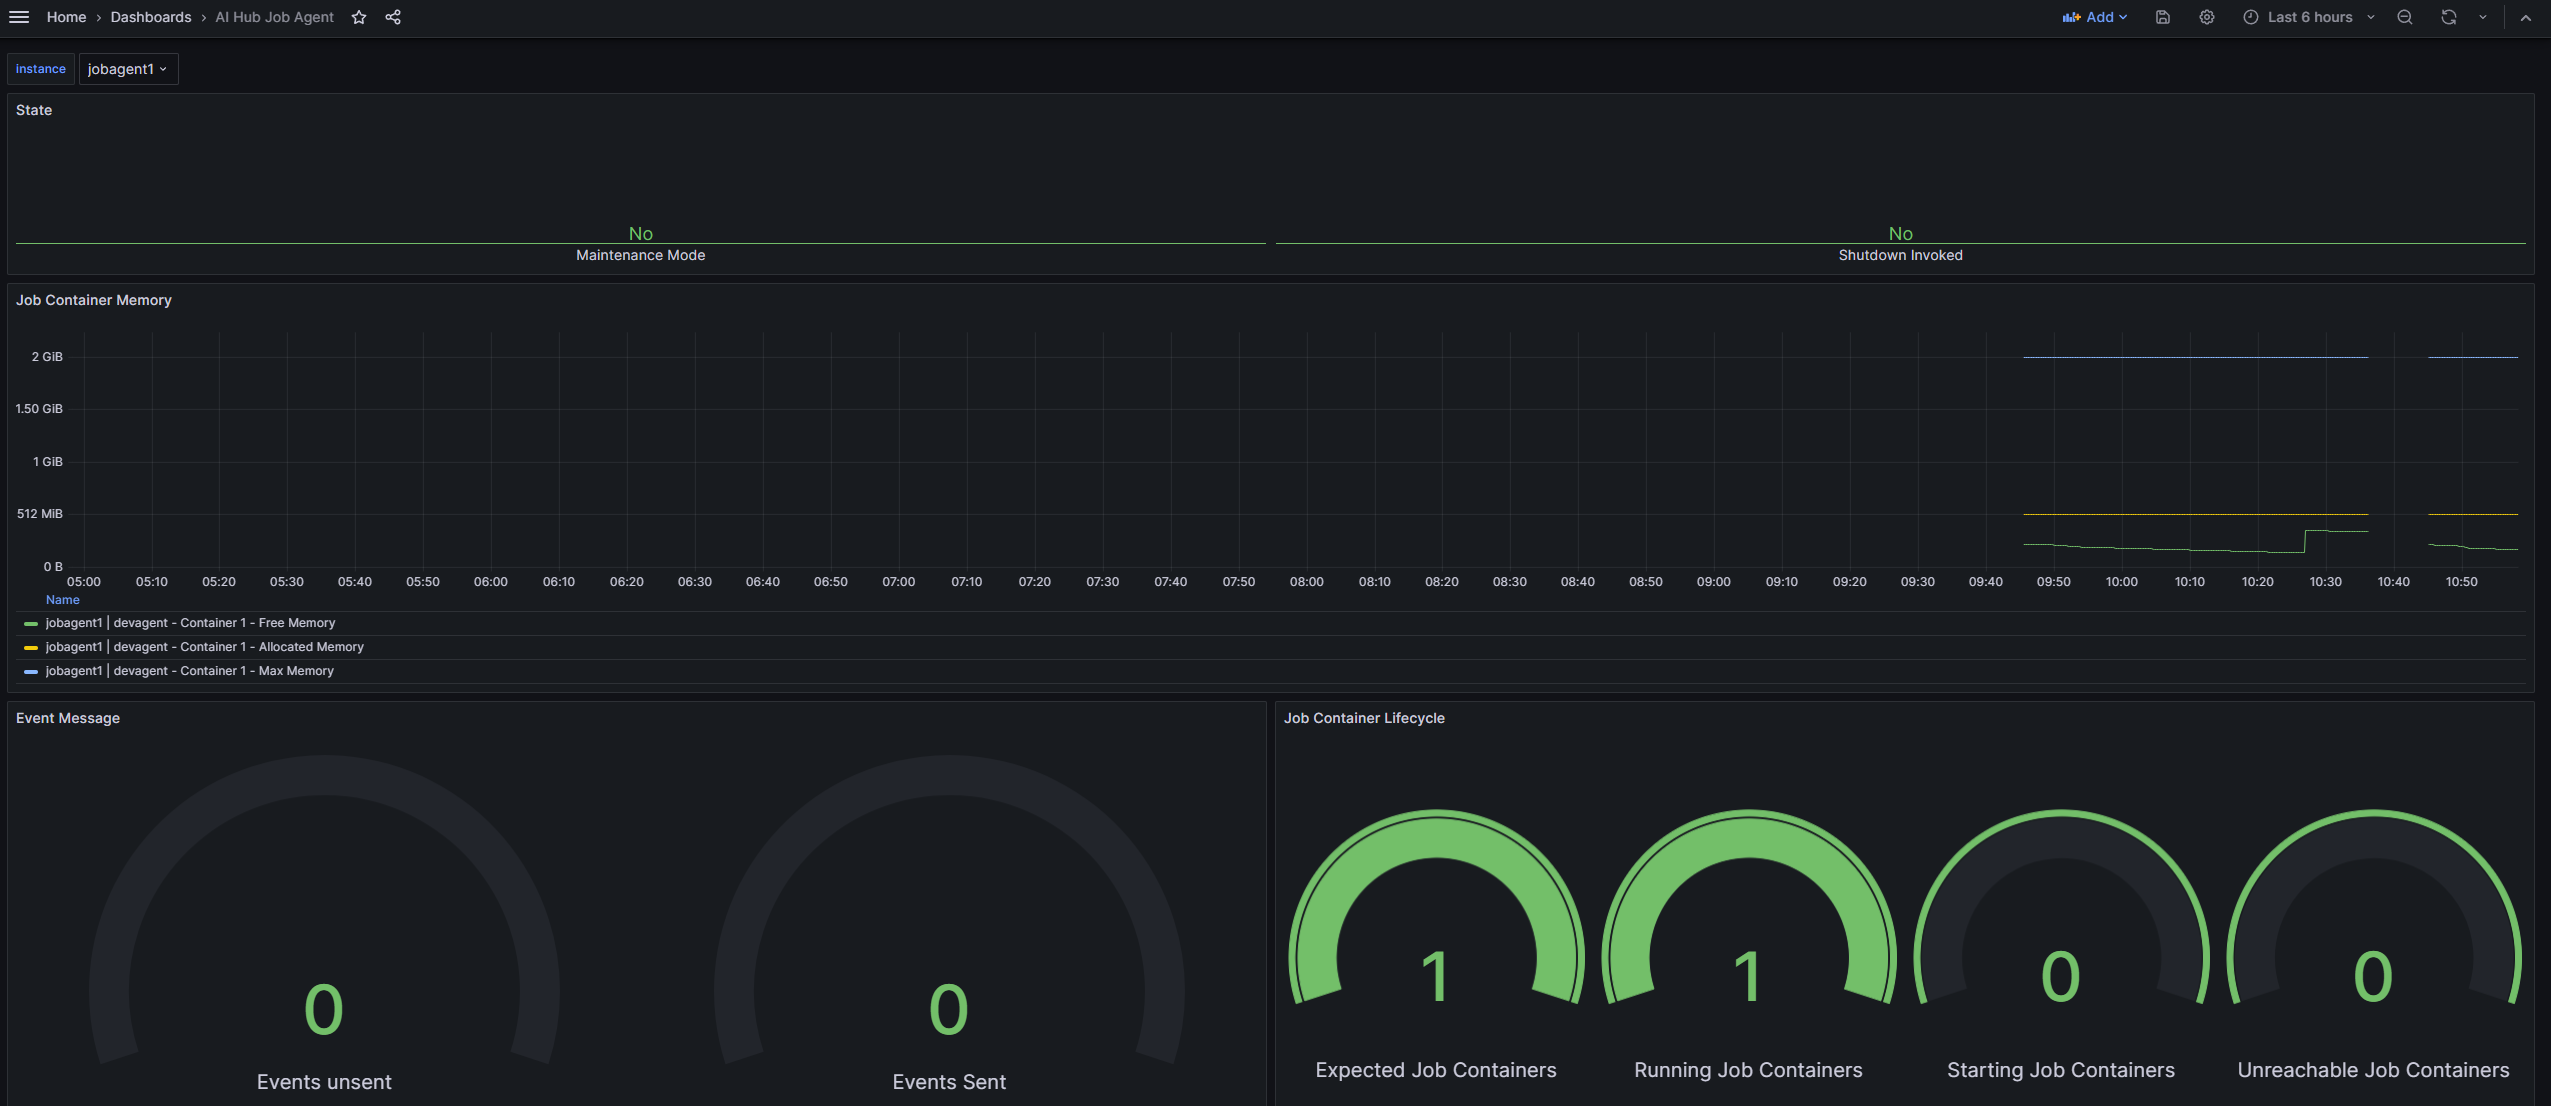
For the Job Agent:
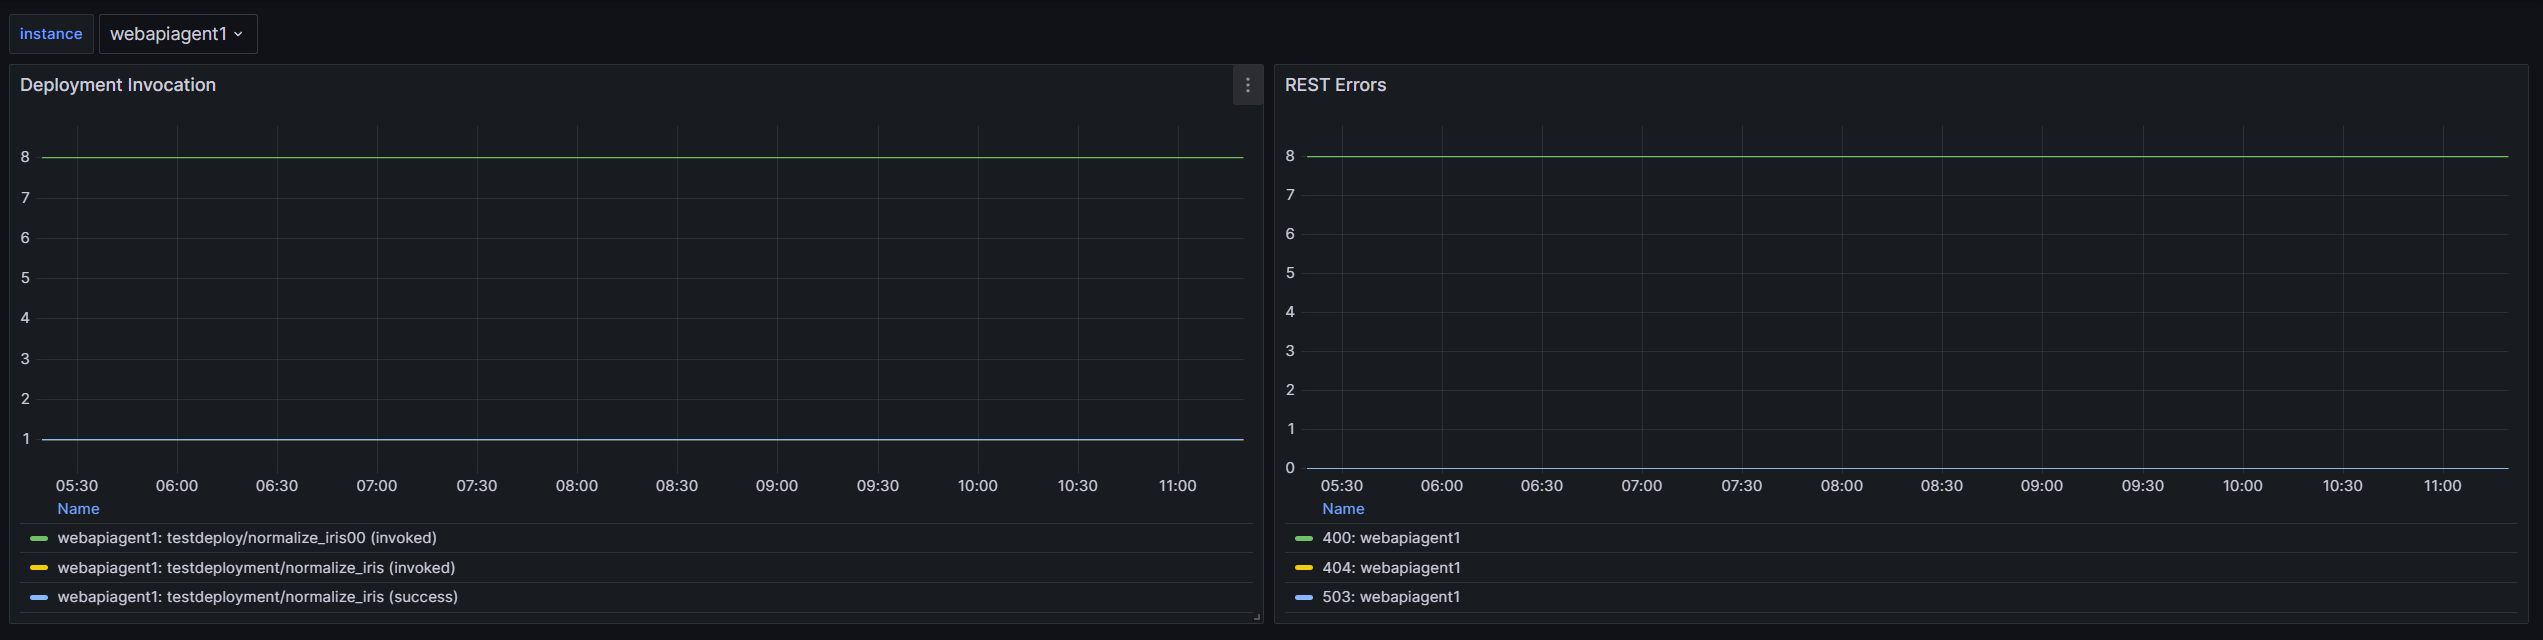
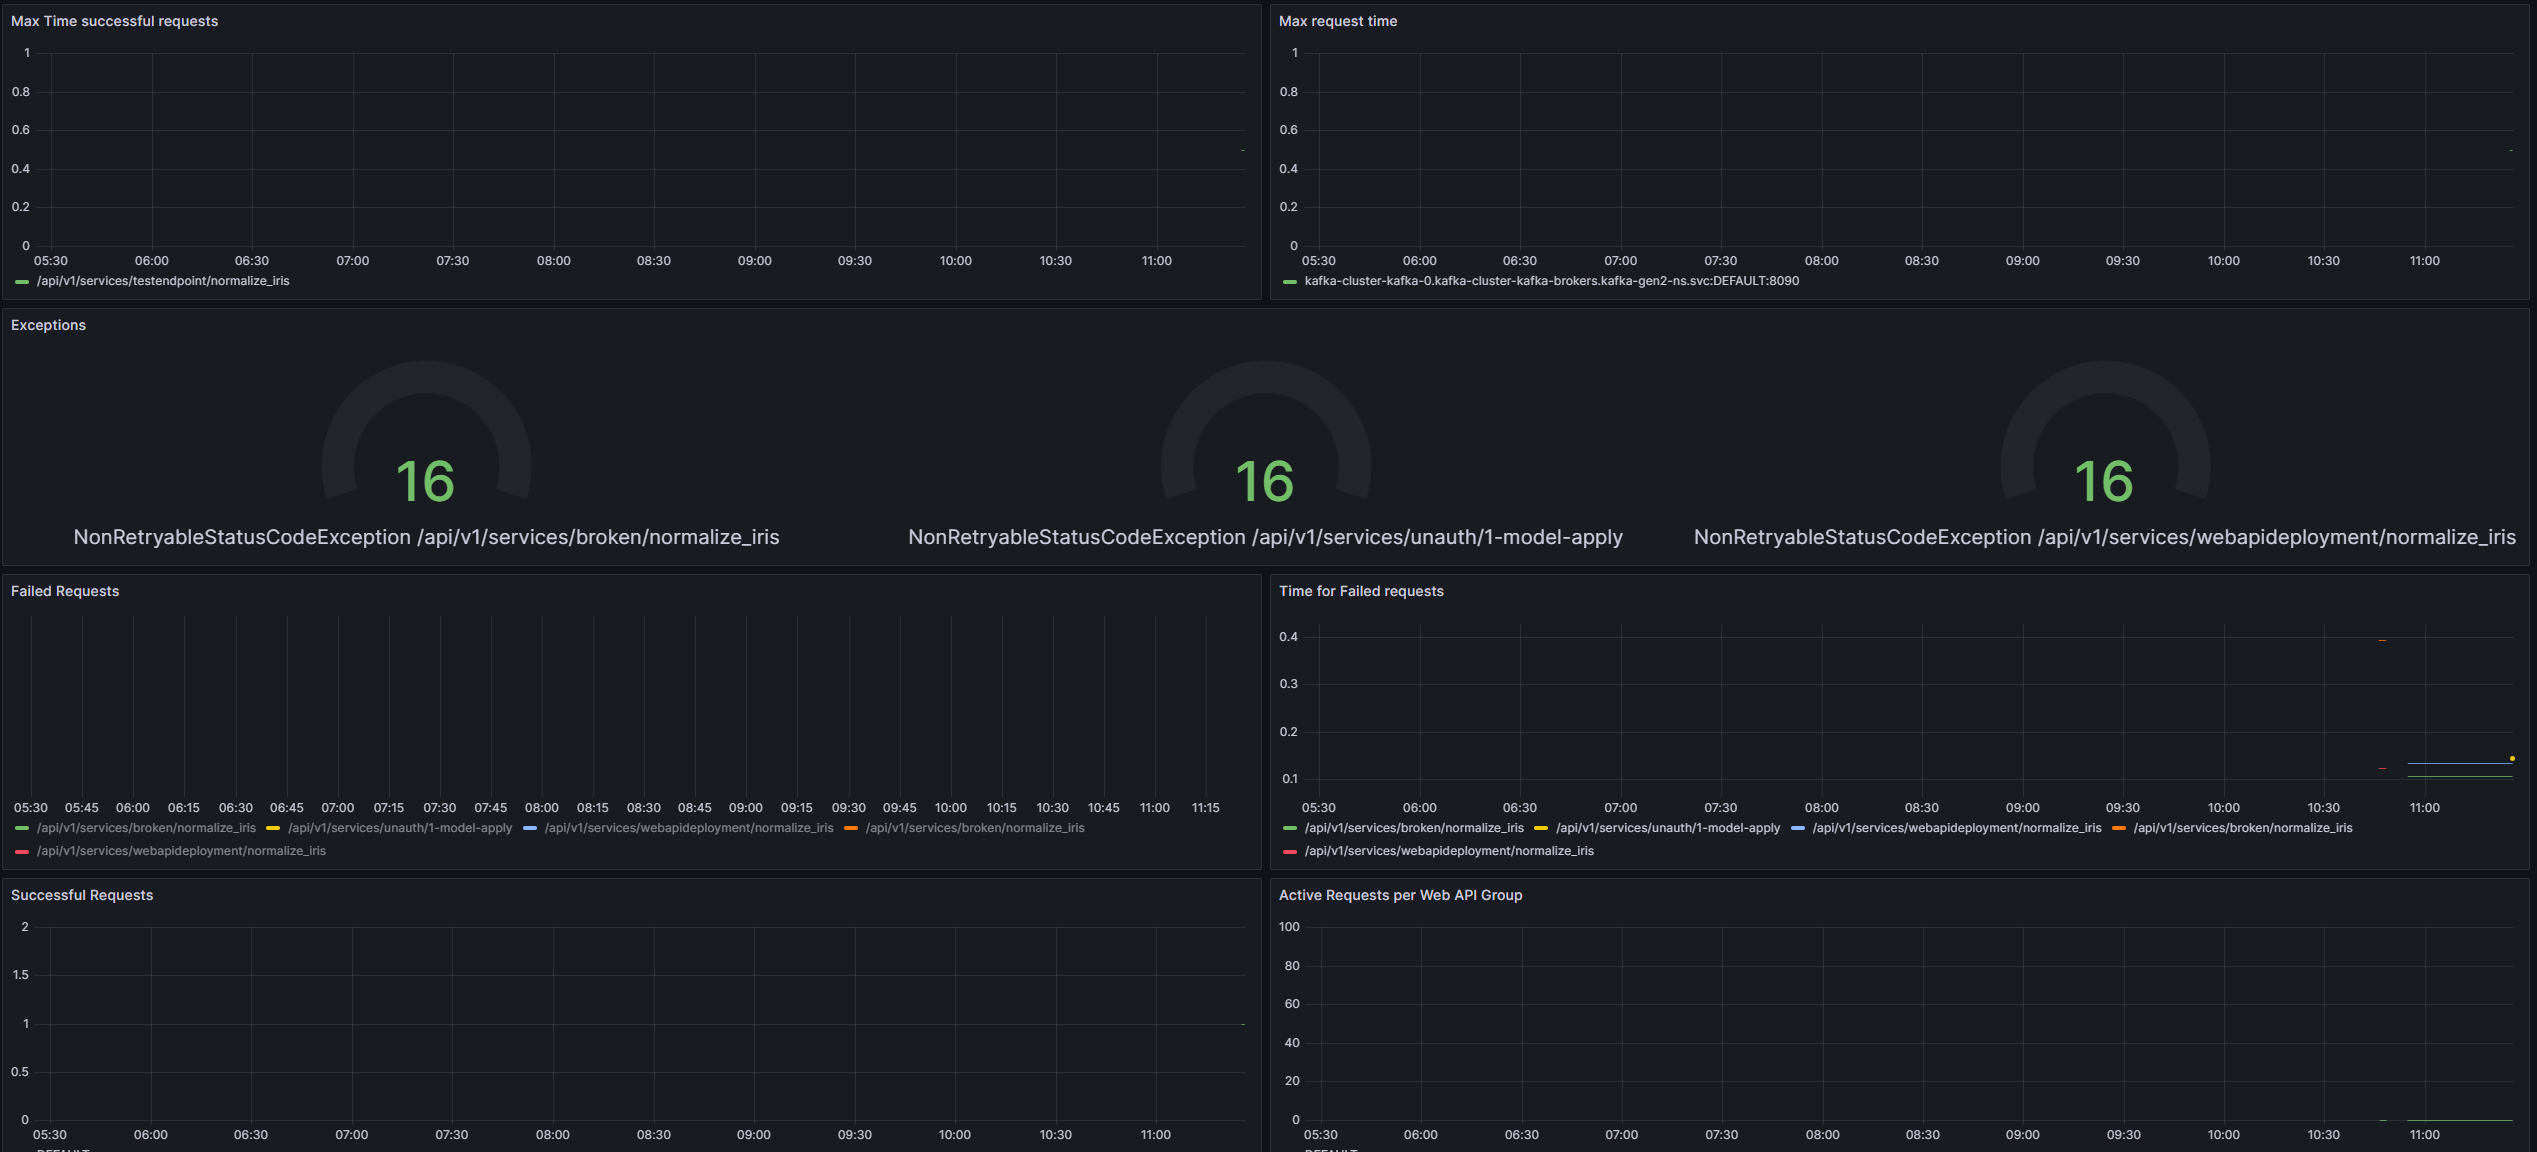
For the Web API Gateway:
For the Web API Agent: